

【 使用环境 】测试环境
【 OB or 其他组件 】OCP
【 使用版本 】 v4.2.2
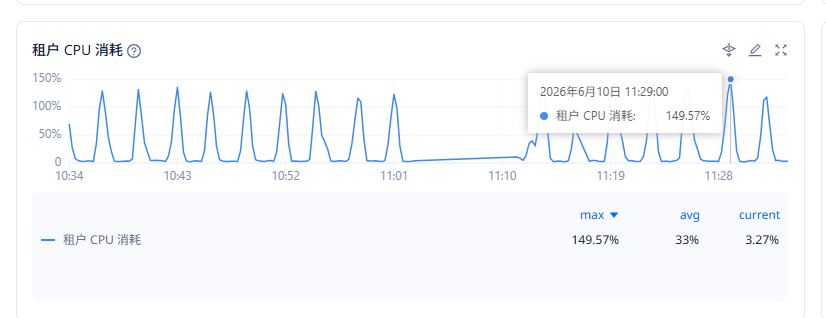
【问题描述】ocp_monitor sql占用CPU过高. 有什么参数可以降低这个sql的占用/或者执行频率吗 ?
- 被管理集群为 observer 4.3.5.5, 1-1-1 集群, 8C 64G .
- ocp_monitor 租户配置为 4C 12G
- ocp_monitor TOP 1 SQL
select
  /*+
          index(ob_hist_plan_cache_plan_logic_explain idx_ob_db_id_sql_id_plan_union_hash)


                  query_timeout(30000000) read_consistency(weak)


          */
  collect_time as collectTimeUs,
  ob_cluster_id as obClusterId,
  cluster_name as clusterName,
  ob_tenant_id as obTenantId,
  ob_server_id as obServerId,
  plan_id as planId,
  first_load_time as firstLoadTimeUs,
  id as id,
  operator as operator,
  IF(object_type = ?, object_alias, ?) as objectName,
  IF(object_type = ?, object_name, ?) as objectAlias,
  cardinality as rows,
  cost as cost,
  real_cardinality as realRows,
  real_cost as realCost,
  io_cost as ioCost,
  cpu_cost as cpuCost,
  projection as projection,
  filter_predicates as filterPredicates,
  startup_predicates as startupPredicates,
  rowset as rowset,
  access_predicates as accessPredicates,
  partition_start as partitionStart,
  special_predicates as specialPredicates,
  depth as depth,
  other_tag as otherTag,
  remarks as remarks,
  other_xml as otherXml,
  optimizer as optimizer,
  other as other,
  gmt_create as create_time
from
  ob_hist_plan_cache_plan_logic_explain
where
  collect_time >= ?
  and collect_time < ?
  and ob_cluster_id = ?
  and cluster_name = ?
  and ob_tenant_id = ?
  and ob_server_id = ?
  and plan_union_hash = ?

【附件及日志】
【备注】基于 LLM 和开源文档 RAG 的论坛小助手已开放测试,在发帖时输入 [@论坛小助手] 即可召唤小助手,欢迎试用!