

【 使用环境 】生产环境
【 OB or 其他组件 】
【 使用版本 】4.2
【问题描述】租户进行了数据批量导入,内存占比超90%,长时间不能自动释放
【复现路径】用户租户进行了数据批量导入。
【附件及日志】推荐使用OceanBase敏捷诊断工具obdiag收集诊断信息,详情参见链接(右键跳转查看):

1、问题中贴的这张图是 ocp还是ocp express的,麻烦图截全一些。
2、对应的ocp(express) 版本。
3、observer的版本 show variables like ‘version_comment’;
ocp express
我主要关注是用户租户的内存持续增高。
ocp租户本身初始化没有太多的资源配额。

帮忙分别提供以下sql的查询结果看看:
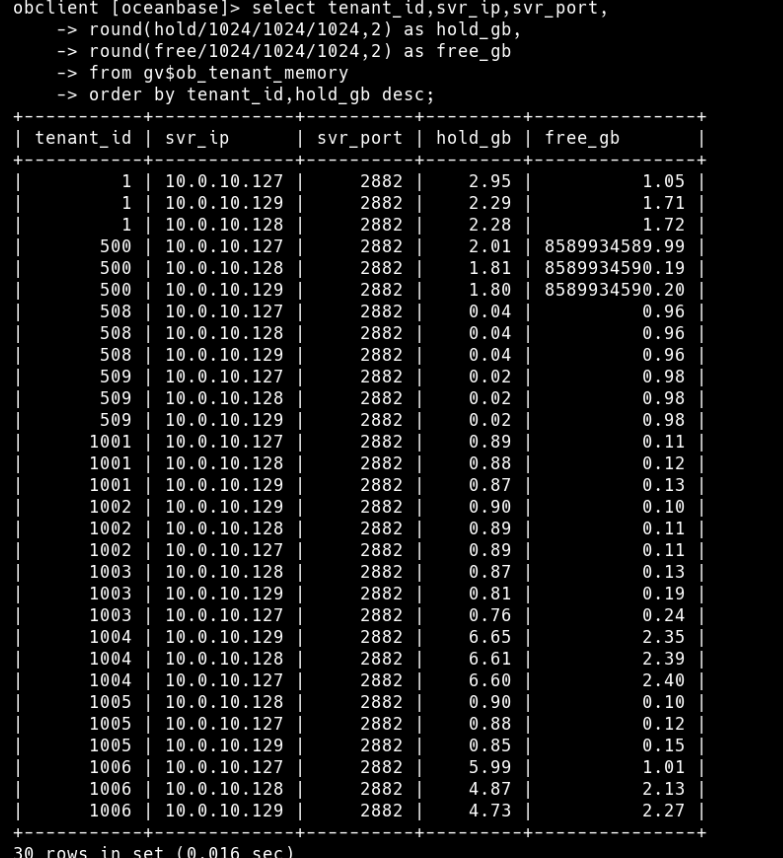
SQ1:
select tenant_id,svr_ip,svr_port,
round(hold/1024/1024/1024,2) as hold_gb,
round(free/1024/1024/1024,2) as free_gb
from gv$ob_tenant_memory
order by tenant_id,hold_gb desc;
SQL2:
select tenant_id from dba_ob_tenants where tenant_name=‘xxx’;
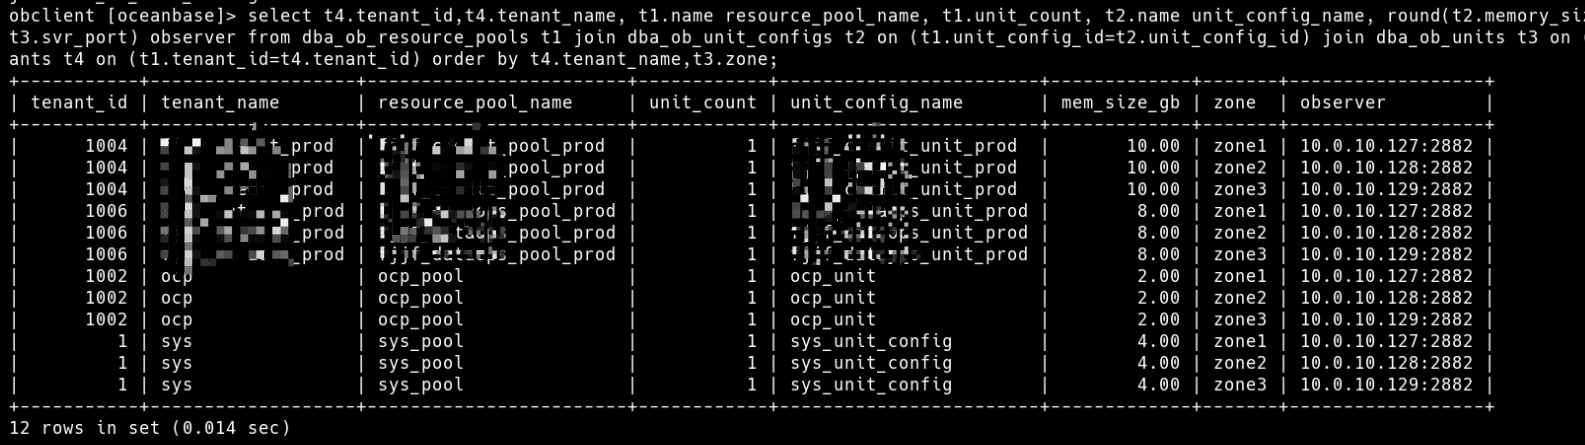
SQL3:
select t4.tenant_id,t4.tenant_name,
t1.name resource_pool_name, t1.unit_count,
t2.name unit_config_name,
round(t2.memory_size/1024/1024/1024,2) mem_size_gb,
t3.zone, concat(t3.svr_ip,’:’,t3.svr_port) observer
from dba_ob_resource_pools t1
join dba_ob_unit_configs t2 on (t1.unit_config_id=t2.unit_config_id)
join dba_ob_units t3 on (t1.resource_pool_id = t3.resource_pool_id)
left join dba_ob_tenants t4 on (t1.tenant_id=t4.tenant_id)
order by t4.tenant_name,t3.zone;
SQL4:
select zone,svr_ip,svr_port,
round(memory_limit/1024/1024/1024,2) as mem_total_gb,
round((memory_limit-mem_capacity)/1024/1024/1024,2) as system_mem_gb,
round(mem_assigned/1024/1024/1024,2) as mem_assigned_gb,
round((mem_capacity-mem_assigned)/1024/1024/1024,2) as mem_free_gb
from gv$ob_servers;

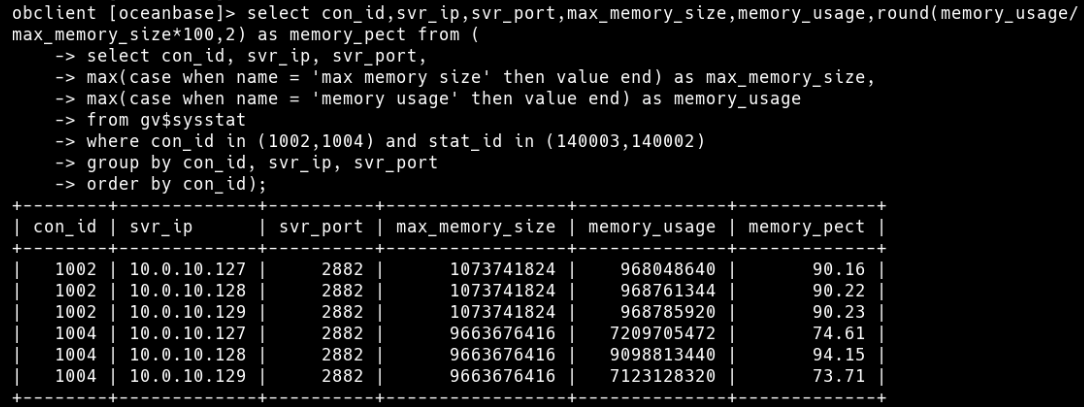
select con_id,svr_ip,svr_port,max_memory_size,memory_usage,round(memory_usage/max_memory_size*100,2) as memory_pect from (
select con_id, svr_ip, svr_port,
max(case when name = ‘max memory size’ then value end) as max_memory_size,
max(case when name = ‘memory usage’ then value end) as memory_usage
from gv$sysstat
where con_id in (1002,1004) and stat_id in (140003,140002)
group by con_id, svr_ip, svr_port
order by con_id);
帮忙在查一下这条sql 看看:
select tenant_name, svr_ip,
memstore_limit /(1024 * 1024 * 1024) as memstore_limit_GB,
freeze_trigger /(1024 * 1024 * 1024) as freeze_trigger_GB,
memstore_used /(1024 * 1024 * 1024) as memstore_used_GB,
concat((memstore_used * 100 / memstore_limit), ‘%’) as memstore_used_percent,
active_span /(1024 * 1024 * 1024) as active_span_GB,
freeze_cnt
from GV$OB_MEMSTORE memstore_info
inner join DBA_OB_TENANTS tenant on memstore_info.tenant_id = tenant.tenant_id
ORDER BY tenant.tenant_name,svr_ip;

老师,内存一直持高不下,怎么破?
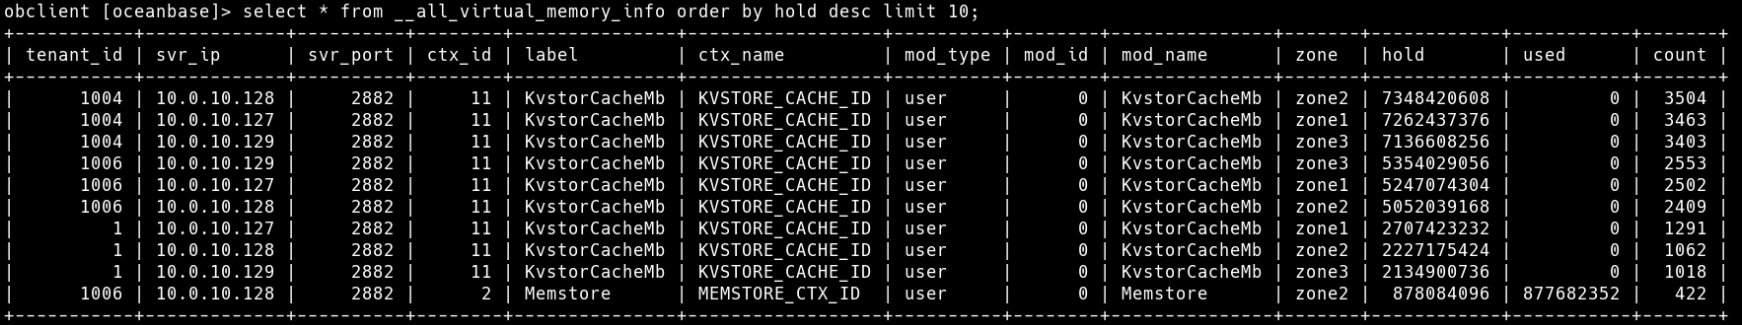
select * from __all_virtual_memory_info order by hold desc limit 10 查下看下
手动合并不清楚有没有作用
- 数据批量导入,多少条提交一次呢
- 转储相关参数是什么
- observer.log中所有租户相关的CTX关键字,查看占用内存最多的是哪个,是KVCACHE还是memstore
查下__all_virtual_kvcache_info看看
查出来177条,要那哪个排序不?太多贴不上来
select * from __all_virtual_kvcache_info order by kv_cnt desc limit 20;这样吧
select * from __all_virtual_kvcache_info order by kv_cnt desc limit 20;
±----------±------------±---------±-------------------±---------±---------±-----------±-----------------±---------------±-------±----------±--------------±--------------±---------------±--------
–+
| tenant_id | svr_ip | svr_port | cache_name | cache_id | priority | cache_size | cache_store_size | cache_map_size | kv_cnt | hit_ratio | total_put_cnt | total_hit_cnt | total_miss_cnt | hold_siz
e |
±----------±------------±---------±-------------------±---------±---------±-----------±-----------------±---------------±-------±----------±--------------±--------------±---------------±--------
–+
| 1004 | 10.0.10.127 | 2882 | user_block_cache | 5 | 1 | 6862362624 | 6841565184 | 20797440 | 130541 | 99.995 | 241223 | 609217777 | 27438 |
0 |
| 1004 | 10.0.10.129 | 2882 | user_block_cache | 5 | 1 | 6847798272 | 6829080576 | 18717696 | 127558 | 99.969 | 226148 | 34010750 | 10587 |
0 |
| 1004 | 10.0.10.128 | 2882 | user_block_cache | 5 | 1 | 7051715584 | 7037157376 | 14558208 | 87971 | 99.974 | 489470 | 2159760758 | 567410 |
0 |
| 1 | 10.0.10.128 | 2882 | user_block_cache | 5 | 1 | 1487742976 | 1475264512 | 12478464 | 87535 | 99.977 | 87535 | 265119409 | 61228 |
0 |
| 1 | 10.0.10.129 | 2882 | user_block_cache | 5 | 1 | 1425319936 | 1412841472 | 12478464 | 84307 | 17.879 | 84307 | 10951 | 50300 |
0 |
| 1004 | 10.0.10.127 | 2882 | user_row_cache | 6 | 1 | 126921728 | 116523008 | 10398720 | 65742 | 99.122 | 120208 | 22883391 | 202800 |
0 |
| 1 | 10.0.10.127 | 2882 | user_block_cache | 5 | 1 | 1075751936 | 1065353216 | 10398720 | 64678 | 99.997 | 93481 | 31988933369 | 897825 |
0 |
| 1004 | 10.0.10.128 | 2882 | user_row_cache | 6 | 1 | 126922752 | 118603776 | 8318976 | 41838 | 98.273 | 91749 | 218466639 | 3838887 |
0 |
| 1006 | 10.0.10.129 | 2882 | user_block_cache | 5 | 1 | 5139493888 | 5133254656 | 6239232 | 40673 | 89.918 | 45246 | 10664447 | 1195778 |
0 |
| 1006 | 10.0.10.127 | 2882 | user_row_cache | 6 | 1 | 1352496128 | 1346256896 | 6239232 | 33563 | 99.645 | 495387 | 2864524991 | 10196785 |
0 |
| 1006 | 10.0.10.128 | 2882 | user_block_cache | 5 | 1 | 5185270784 | 5179031552 | 6239232 | 33407 | 87.764 | 40985 | 224822855 | 31345735 |
0 |
| 1006 | 10.0.10.127 | 2882 | user_block_cache | 5 | 1 | 3762025472 | 3755786240 | 6239232 | 31026 | 99.803 | 45847 | 802759492 | 1584942 |
0 |
| 1003 | 10.0.10.129 | 2882 | user_block_cache | 5 | 1 | 507705344 | 503545856 | 4159488 | 29124 | 72.741 | 234882 | 6367 | 2386 |
0 |
| 1003 | 10.0.10.128 | 2882 | user_block_cache | 5 | 1 | 486897664 | 482738176 | 4159488 | 27879 | 77.555 | 242051 | 6147 | 1779 |
0 |
| 1003 | 10.0.10.127 | 2882 | user_block_cache | 5 | 1 | 484816896 | 480657408 | 4159488 | 23615 | 99.996 | 416336 | 1465342813 | 56568 |
0 |
| 1004 | 10.0.10.129 | 2882 | user_row_cache | 6 | 1 | 41613312 | 37453824 | 4159488 | 20276 | 96.828 | 31132 | 2489424 | 81555 |
0 |
| 1001 | 10.0.10.129 | 2882 | user_block_cache | 5 | 1 | 318355456 | 314195968 | 4159488 | 17879 | 77.537 | 242707 | 8978 | 2601 |
0 |
| 1 | 10.0.10.127 | 2882 | tablet_table_cache | 2 | 1001 | 8321024 | 4161536 | 4159488 | 17335 | 100.000 | 17335 | 10062 | 0 |
0 |
| 1006 | 10.0.10.129 | 2882 | fuse_row_cache | 8 | 1 | 104036352 | 99876864 | 4159488 | 17314 | 98.816 | 106079 | 3656205 | 43820 |
0 |
| 1 | 10.0.10.128 | 2882 | tablet_table_cache | 2 | 1001 | 8321024 | 4161536 | 4159488 | 17123 | 100.000 | 17123 | 9971 | 0 |
0 |
±----------±------------±---------±-------------------±---------±---------±-----------±-----------------±---------------±-------±----------±--------------±--------------±---------------±--------
–+
20 rows in set (0.013 sec)
alter system flush kvcache tenant tenant_name cache ‘user_block_cache’; 执行这个命令手动清理一下cache,然后再看下内存情况