【 使用环境 】生产环境
【 OB or 其他组件 】OB
【 使用版本 】5.7.25-OceanBase_CE-v4.3.1.0
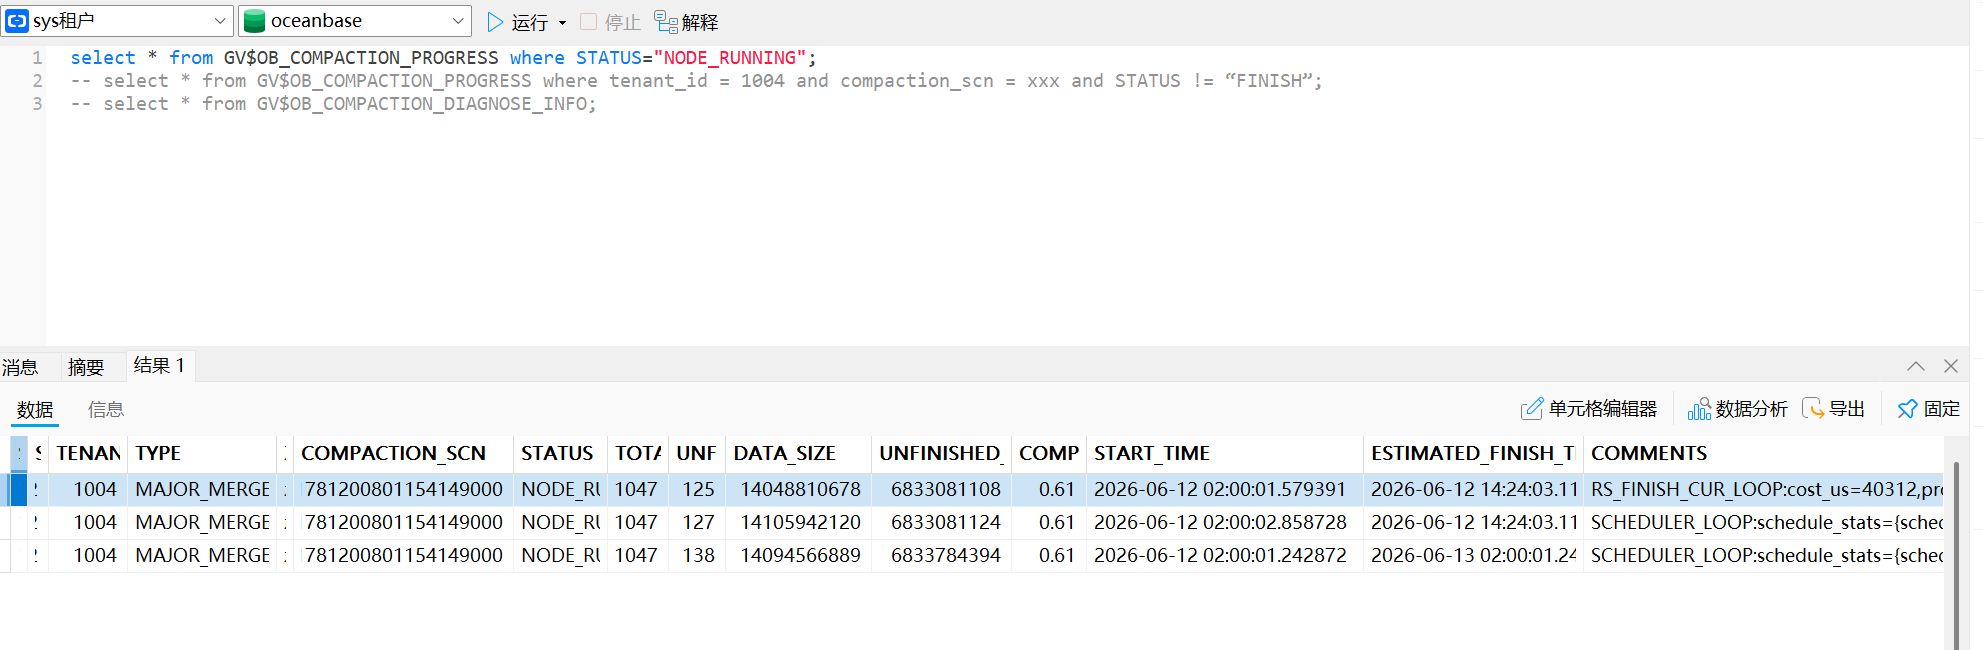
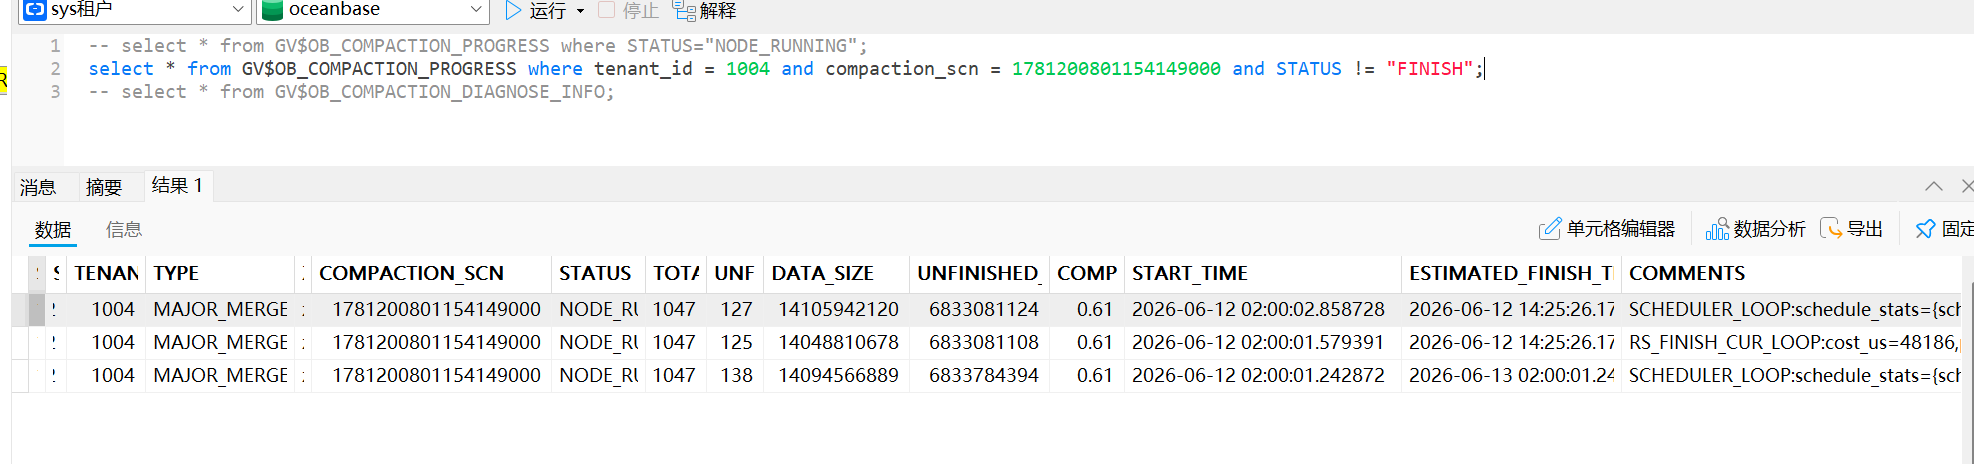
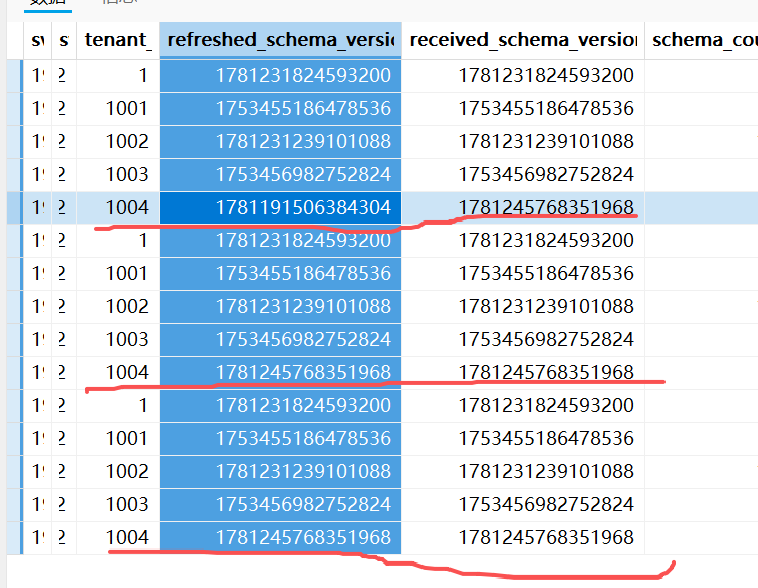
【问题描述】在某租户长时间为合并成功,重启observer后,仍然合并卡住
【附件及日志】
obdiag version: 4.3.0
observer Version: 4.3.1.0
±-----------------------------------------------------------------------------------------+
| record |
±-----±----------------------------------------------------------------------------------+
| step | info |
±-----±----------------------------------------------------------------------------------+
| 1 | observer version: 4.3.1.0 |
| 2 | Starting major compaction hold diagnosis… |
| 3 | Step 1: Checking CDB_OB_MAJOR_COMPACTION for errors |
| 4 | No compaction errors found (IS_ERROR=‘YES’) |
| 5 | Step 2: Checking for suspended compactions |
| 6 | No suspended compactions found |
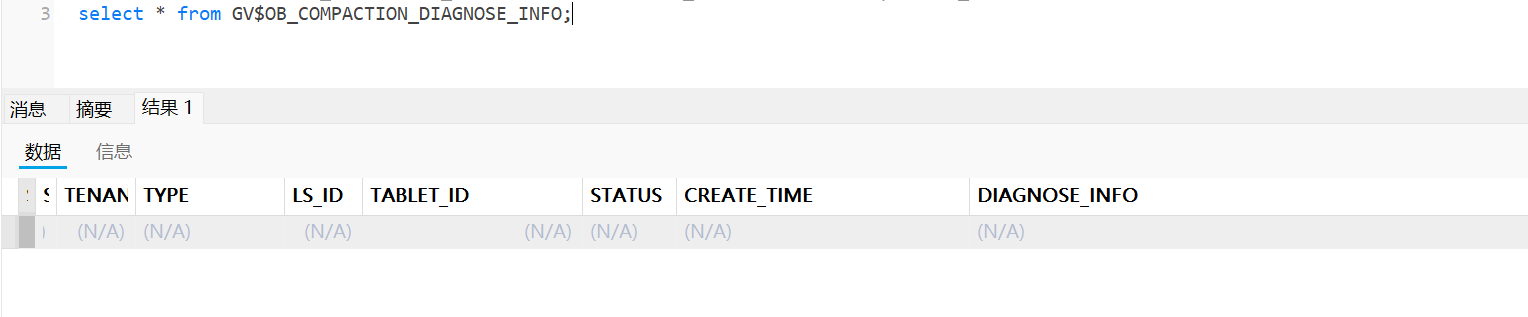
| 7 | Step 3: Checking __all_virtual_compaction_diagnose_info for failures |
| 8 | No failed compaction tasks in diagnose info |
| 9 | Step 4: Checking for long-running compaction tasks (>20 minutes) |ccccc
| 10 | Found long-running compaction tasks in tenants: [‘1004’] |
| 11 | Step 5: Analyzing compaction speed |
| 12 | Tenant 1004 on ccc.2.11:2882: Progress 51.4%, Speed 0.20 MB/s, Elapsed 35000s |
| 13 | Tenant 1004 on xx.xx.xx.12:2882: Progress 51.5%, Speed 0.20 MB/s, Elapsed 35000s |
| 14 | Tenant 1004 on xx.xx.xx.13:2882: Progress 51.6%, Speed 0.20 MB/s, Elapsed 34999s |
| 15 | Tenants requiring detailed diagnosis: [‘1004’] |
±-----±----------------------------------------------------------------------------------+
The suggest: Very slow compaction detected for tenant 1004 (0.20 MB/s). Check disk I/O, memory pressure, or DAG scheduler status.
Very slow compaction detected for tenant 1004 (0.20 MB/s). Check disk I/O, memory pressure, or DAG scheduler status.
Very slow compaction detected for tenant 1004 (0.20 MB/s). Check disk I/O, memory pressure, or DAG scheduler status.
±------------------------------------------------------------------------------------------------------------+
| record |
±-----±-----------------------------------------------------------------------------------------------------+
| step | info |
±-----±-----------------------------------------------------------------------------------------------------+
| 1 | observer version: 4.3.1.0 |
| 2 | Starting major compaction hold diagnosis… |
| 3 | Step 1: Checking CDB_OB_MAJOR_COMPACTION for errors |
| 4 | No compaction errors found (IS_ERROR=‘YES’) |
| 5 | Step 2: Checking for suspended compactions |
| 6 | No suspended compactions found |
| 7 | Step 3: Checking __all_virtual_compaction_diagnose_info for failures |
| 8 | No failed compaction tasks in diagnose info |
| 9 | Step 4: Checking for long-running compaction tasks (>20 minutes) |
| 10 | Found long-running compaction tasks in tenants: [‘1004’] |
| 11 | Step 5: Analyzing compaction speed |
| 12 | Tenant 1004 on xx.xx.xx.11:2882: Progress 51.4%, Speed 0.20 MB/s, Elapsed 35000s |
| 13 | Tenant 1004 on xx.xx.xx.12:2882: Progress 51.5%, Speed 0.20 MB/s, Elapsed 35000s |
| 14 | Tenant 1004 on xx.xx.xx.13:2882: Progress 51.6%, Speed 0.20 MB/s, Elapsed 34999s |
| 15 | Tenants requiring detailed diagnosis: [‘1004’] |
| 16 | === Detailed diagnosis for tenant_id: 1004 === |
| 17 | Step 1: Getting CDB_OB_MAJOR_COMPACTION status |
| 18 | Compaction status: [{“TENANT_ID”: 1004, “FROZEN_SCN”: 1781200801154149000, “FROZEN_TIME”: |
| | “2026-06-12 02:00:01”, “GLOBAL_BROADCAST_SCN”: 1781200801154149000, “LAST_SCN”: 1779732001889884001, |
| | “LAST_FINISH_TIME”: “2026-06-11 23:31:45”, “START_TIME”: “2026-06-12 02:00:01”, “STATUS”: |
| | “COMPACTING”, “IS_ERROR”: “NO”, “IS_SUSPENDED”: “NO”, “INFO”: “”}] |
| 19 | Step 2: Analyzing diagnose info |
| 20 | Step 3: Getting compaction progress details |
| 21 | GLOBAL_BROADCAST_SCN: 1781200801154149000, LAST_SCN: 1779732001889884001 |
| 22 | Step 4: Getting compaction history |
| 23 | Saved 100 compaction history records |
| 24 | Step 5: Getting compaction suggestions |
| 25 | Step 6: Getting DAG scheduler status |
| 26 | DAG scheduler info collected |
| 27 | Step 7: Getting DAG task status |
| 28 | Step 8: Collecting dmesg logs |
| 29 | Collected dmesg from local |
| 30 | Collected dmesg from remote_xx_xx_xx_12 |
| 31 | Collected dmesg from remote_xx_xx_xx_13 |
| 32 | Step 9: Collecting relevant observer logs |
| 33 | Step 10: Checking for duplicate index names |
| 34 | Checking for duplicate index names that may cause compaction hold… |
| 35 | No duplicate index names found across different tables |
| 36 | Step 11: Checking DDL task status |
| 37 | Checking DDL task status… |
| 38 | No DDL tasks found |
| 39 | Found 20 DDL error records |
| 40 | DDL error: task_id=None, ret_code=None, message= |
| 41 | DDL error: task_id=None, ret_code=None, message= |
| 42 | DDL error: task_id=None, ret_code=None, message= |
| 43 | DDL error: task_id=None, ret_code=None, message= |
| 44 | DDL error: task_id=None, ret_code=None, message= |
| 45 | Step 12: Checking memory throttling issues |
| 46 | Checking memory throttling issues (Issue #1107)… |
| 47 | Tenant memory usage: |
| 48 | Server xx.xx.xx.11:2882: hold=40.86GB, limit=50.0GB, usage=81.72% |
| 49 | Server xx.xx.xx.13:2882: hold=40.69GB, limit=50.0GB, usage=81.38% |
| 50 | Server xx.xx.xx.12:2882: hold=31.5GB, limit=50.0GB, usage=63.0% |
| 51 | Memstore info: |
| 52 | Server xx.xx.xx.11:2882: memstore_usage=8.95%, writing_throttling_trigger=60.0% |
| 53 | Server xx.xx.xx.12:2882: memstore_usage=8.9%, writing_throttling_trigger=60.0% |
| 54 | Server xx.xx.xx.13:2882: memstore_usage=7.65%, writing_throttling_trigger=60.0% |
| 55 | Checking TxShare throttling limit vs meta tenant memory limit… |
| 56 | Meta tenant (tenant_id=1) memory limits: |
| 57 | Server xx.xx.xx.11:2882: limit=20.0GB, hold=4.58GB |
| 58 | Server xx.xx.xx.12:2882: limit=20.0GB, hold=2.45GB |
| 59 | Server xx.xx.xx.13:2882: limit=20.0GB, hold=2.42GB |
| 60 | Throttling-related parameters: |
| 61 | Server xx.xx.xx.11: log_disk_throttling_maximum_duration = 2h |
| 62 | Server xx.xx.xx.11: log_disk_throttling_maximum_duration = 2h |
| 63 | Server xx.xx.xx.11: log_disk_throttling_maximum_duration = 2h |
| 64 | Server xx.xx.xx.11: log_disk_throttling_maximum_duration = 2h |
| 65 | Server xx.xx.xx.11: log_disk_throttling_maximum_duration = 2h |
| 66 | Server xx.xx.xx.12: log_disk_throttling_maximum_duration = 2h |
| 67 | Server xx.xx.xx.12: log_disk_throttling_maximum_duration = 2h |
| 68 | Server xx.xx.xx.12: log_disk_throttling_maximum_duration = 2h |
| 69 | Server xx.xx.xx.12: log_disk_throttling_maximum_duration = 2h |
| 70 | Server xx.xx.xx.12: log_disk_throttling_maximum_duration = 2h |
| 71 | Server xx.xx.xx.13: log_disk_throttling_maximum_duration = 2h |
| 72 | Server xx.xx.xx.13: log_disk_throttling_maximum_duration = 2h |
| 73 | Server xx.xx.xx.13: log_disk_throttling_maximum_duration = 2h |
| 74 | Server xx.xx.xx.13: log_disk_throttling_maximum_duration = 2h |
| 75 | Server xx.xx.xx.13: log_disk_throttling_maximum_duration = 2h |
| 76 | Server xx.xx.xx.11: log_disk_throttling_percentage = 60 |
| 77 | Server xx.xx.xx.11: log_disk_throttling_percentage = 60 |
| 78 | Server xx.xx.xx.11: log_disk_throttling_percentage = 60 |
| 79 | Server xx.xx.xx.11: log_disk_throttling_percentage = 60 |
| 80 | Server xx.xx.xx.11: log_disk_throttling_percentage = 60 |
| 81 | Server xx.xx.xx.12: log_disk_throttling_percentage = 60 |
| 82 | Server xx.xx.xx.12: log_disk_throttling_percentage = 60 |
| 83 | Server xx.xx.xx.12: log_disk_throttling_percentage = 60 |
| 84 | Server xx.xx.xx.12: log_disk_throttling_percentage = 60 |
| 85 | Server xx.xx.xx.12: log_disk_throttling_percentage = 60 |
| 86 | Server xx.xx.xx.13: log_disk_throttling_percentage = 60 |
| 87 | Server xx.xx.xx.13: log_disk_throttling_percentage = 60 |
| 88 | Server xx.xx.xx.13: log_disk_throttling_percentage = 60 |
| 89 | Server xx.xx.xx.13: log_disk_throttling_percentage = 60 |
| 90 | Server xx.xx.xx.13: log_disk_throttling_percentage = 60 |
| 91 | Server xx.xx.xx.11: writing_throttling_maximum_duration = 2h |
| 92 | Server xx.xx.xx.11: writing_throttling_maximum_duration = 2h |
| 93 | Server xx.xx.xx.11: writing_throttling_maximum_duration = 2h |
| 94 | Server xx.xx.xx.11: writing_throttling_maximum_duration = 2h |
| 95 | Server xx.xx.xx.11: writing_throttling_maximum_duration = 2h |
| 96 | Server xx.xx.xx.12: writing_throttling_maximum_duration = 2h |
| 97 | Server xx.xx.xx.12: writing_throttling_maximum_duration = 2h |
| 98 | Server xx.xx.xx.12: writing_throttling_maximum_duration = 2h |
| 99 | Server xx.xx.xx.12: writing_throttling_maximum_duration = 2h |
| 100 | Server xx.xx.xx.12: writing_throttling_maximum_duration = 2h |
| 101 | Server xx.xx.xx.13: writing_throttling_maximum_duration = 2h |
| 102 | Server xx.xx.xx.13: writing_throttling_maximum_duration = 2h |
| 103 | Server xx.xx.xx.13: writing_throttling_maximum_duration = 2h |
| 104 | Server xx.xx.xx.13: writing_throttling_maximum_duration = 2h |
| 105 | Server xx.xx.xx.13: writing_throttling_maximum_duration = 2h |
| 106 | Server xx.xx.xx.11: writing_throttling_trigger_percentage = 60 |
| 107 | Server xx.xx.xx.11: writing_throttling_trigger_percentage = 60 |
| 108 | Server xx.xx.xx.11: writing_throttling_trigger_percentage = 60 |
| 109 | Server xx.xx.xx.11: writing_throttling_trigger_percentage = 60 |
| 110 | Server xx.xx.xx.11: writing_throttling_trigger_percentage = 60 |
| 111 | Server xx.xx.xx.12: writing_throttling_trigger_percentage = 60 |
| 112 | Server xx.xx.xx.12: writing_throttling_trigger_percentage = 60 |
| 113 | Server xx.xx.xx.12: writing_throttling_trigger_percentage = 60 |
| 114 | Server xx.xx.xx.12: writing_throttling_trigger_percentage = 60 |
| 115 | Server xx.xx.xx.12: writing_throttling_trigger_percentage = 60 |
| 116 | Server xx.xx.xx.13: writing_throttling_trigger_percentage = 60 |
| 117 | Server xx.xx.xx.13: writing_throttling_trigger_percentage = 60 |
| 118 | Server xx.xx.xx.13: writing_throttling_trigger_percentage = 60 |
| 119 | Server xx.xx.xx.13: writing_throttling_trigger_percentage = 60 |
| 120 | Server xx.xx.xx.13: writing_throttling_trigger_percentage = 60 |
| 121 | Server xx.xx.xx.11: _tx_share_memory_limit_percentage = 0 |
| 122 | Server xx.xx.xx.11: _tx_share_memory_limit_percentage = 0 |
| 123 | Server xx.xx.xx.11: _tx_share_memory_limit_percentage = 0 |
| 124 | Server xx.xx.xx.11: _tx_share_memory_limit_percentage = 0 |
| 125 | Server xx.xx.xx.11: _tx_share_memory_limit_percentage = 0 |
| 126 | Server xx.xx.xx.12: _tx_share_memory_limit_percentage = 0 |
| 127 | Server xx.xx.xx.12: _tx_share_memory_limit_percentage = 0 |
| 128 | Server xx.xx.xx.12: _tx_share_memory_limit_percentage = 0 |
| 129 | Server xx.xx.xx.12: _tx_share_memory_limit_percentage = 0 |
| 130 | Server xx.xx.xx.12: _tx_share_memory_limit_percentage = 0 |
| 131 | Server xx.xx.xx.13: _tx_share_memory_limit_percentage = 0 |
| 132 | Server xx.xx.xx.13: _tx_share_memory_limit_percentage = 0 |
| 133 | Server xx.xx.xx.13: _tx_share_memory_limit_percentage = 0 |
| 134 | Server xx.xx.xx.13: _tx_share_memory_limit_percentage = 0 |
| 135 | Server xx.xx.xx.13: _tx_share_memory_limit_percentage = 0 |
| 136 | Average meta tenant memory limit: 20.0GB |
| 137 | Checking for memory expansion bug scenario… |
| 138 | Tenant unit configuration: |
| 139 | Server xx.xx.xx.11: memory_size=50.0GB |
| 140 | Server xx.xx.xx.12: memory_size=50.0GB |
| 141 | Server xx.xx.xx.13: memory_size=50.0GB |
| 142 | Checking for throttling-related transaction timeouts… |
| 143 | Step 13: Checking column group schema issue (heterogenous row-to-column) |
| 144 | No SSTABLE_MAJOR_MERGE tasks found (view may not exist in this version) |
±-----±-----------------------------------------------------------------------------------------------------+
The suggest: Please review diagnostic files in ./obdiag_rca/obdiag_major_hold_20260612114322 for detailed analysis