马德龙
#1
【 使用环境 】测试环境
【 OB or 其他组件 】oceanbase-all-in-one 进行安装部署
【 使用版本 】Ubuntu + OceanBase 社区版 4.5
【问题描述】
第一天安装完,登录obshellDashboard没问题,创建租户都没问题
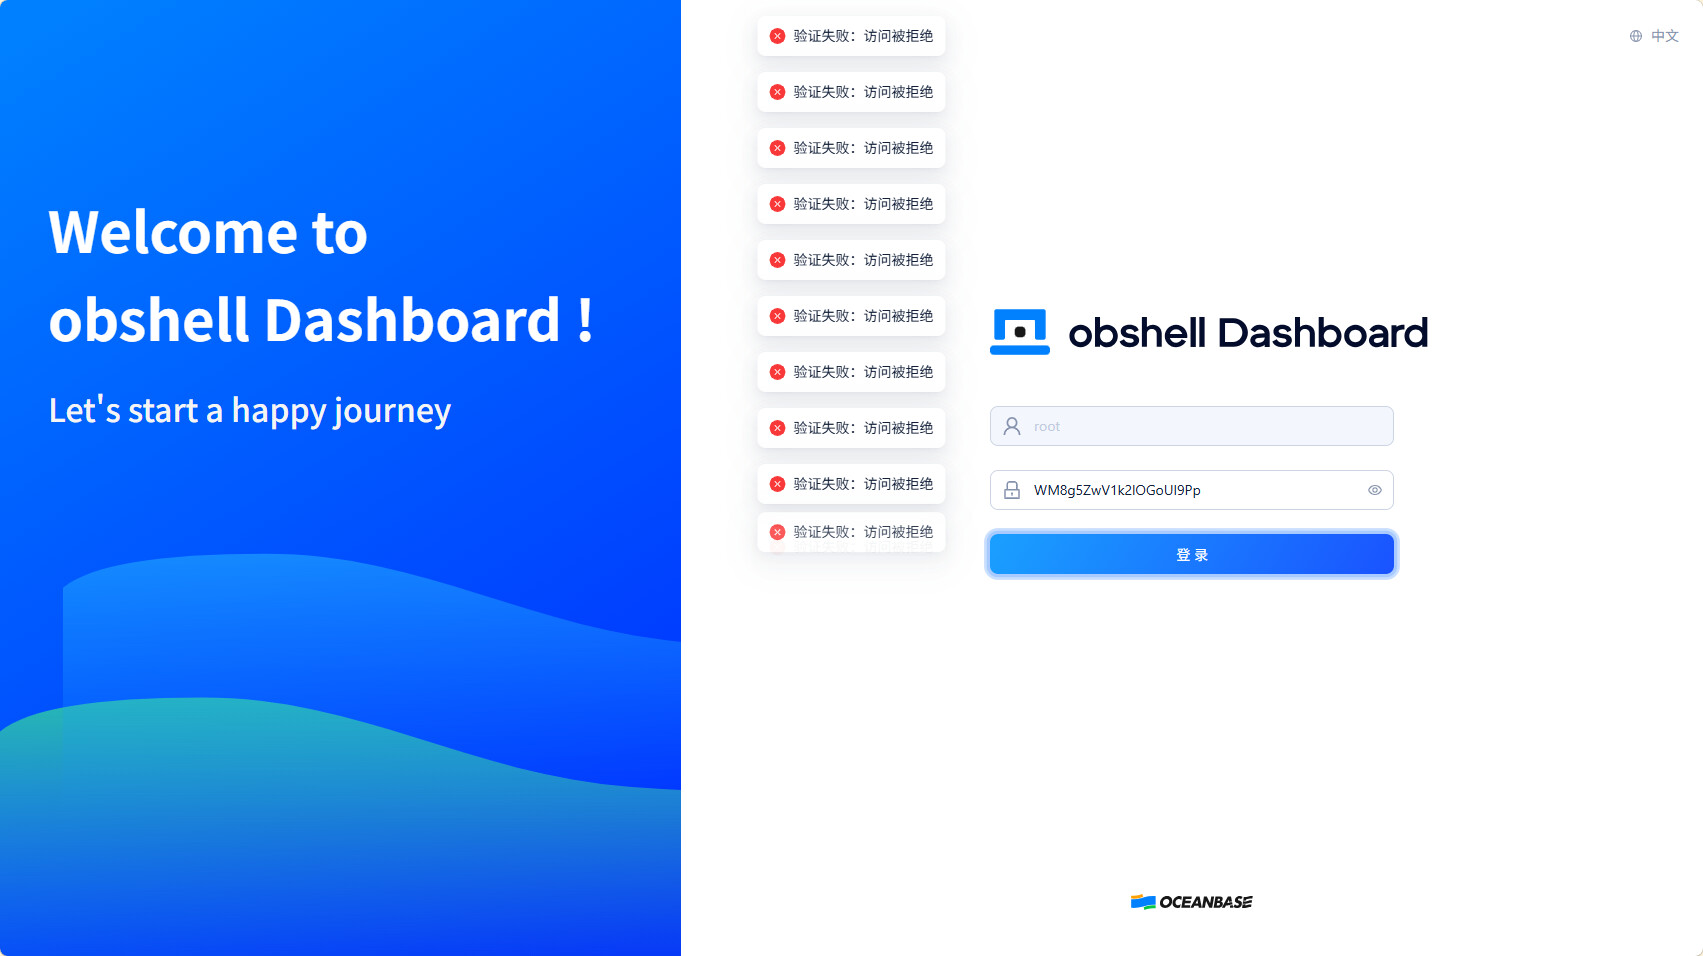
第二天登录obshell Dashboard登陆不上了,提示验证失败:访问被拒绝
目前只有这个dashboard登录不上,navicat可以连接数据库使用,密码也没改过
查看官方文档,查询到:
Security.Authentication.Expired,Authentication expired,认证信息已过期,请更新认证信息后重试。
但是没具体描述如何更新认证信息,还请大佬解惑,感谢。
2 个赞
马德龙
#4
root@ocean:~# obd cluster list
+--------------------------------------------------+
|                   Cluster List                   |
+------+-------------------------+-----------------+
| Name | Configuration Path      | Status (Cached) |
+------+-------------------------+-----------------+
| hiob | /root/.obd/cluster/hiob | running         |
+------+-------------------------+-----------------+
Trace ID: 3d5a89b4-0802-11f1-bb14-000c29d2c599
If you want to view detailed obd logs, please run: obd display-trace 3d5a89b4-0802-11f1-bb14-000c29d2c599
root@ocean:~# obd cluster display hiob
Get local repositories and plugins ok
Open ssh connection ok
Connect to observer 127.0.0.1:2881 ok
Wait for observer init ok
+---------------------------------------------+
|                 oceanbase-ce                |
+-----------+---------+------+-------+--------+
| ip        | version | port | zone  | status |
+-----------+---------+------+-------+--------+
| 127.0.0.1 | 4.5.0.0 | 2881 | zone1 | ACTIVE |
+-----------+---------+------+-------+--------+
obclient -h127.0.0.1 -P2881 -uroot@sys -p'WM8g5ZwV1k2lOGoUI9Pp' -Doceanbase -A

cluster unique id: 931aa190-0108-5b1e-bf0e-616ca5ae1265-19c4a7befc4-00000504

obshell program health check ok
display obshell dashboard ok
+----------------------------------------------------------------+
|                       obshell Dashboard                        |
+-----------------------+------+------------------------+--------+
| url                   | user | password               | status |
+-----------------------+------+------------------------+--------+
| http://127.0.1.1:2886 | root | 'WM8g5ZwV1k2lOGoUI9Pp' | active |
+-----------------------+------+------------------------+--------+

Connect to Obagent ok
+--------------------------------------------------------------+
|                           obagent                            |
+-----------+--------------------+--------------------+--------+
| ip        | mgragent_http_port | monagent_http_port | status |
+-----------+--------------------+--------------------+--------+
| 127.0.1.1 | 8089               | 8088               | active |
+-----------+--------------------+--------------------+--------+
Connect to Prometheus ok
+-------------------------------------------------------+
|                       prometheus                      |
+-----------------------+-------+--------------+--------+
| url                   | user  | password     | status |
+-----------------------+-------+--------------+--------+
| http://127.0.1.1:9090 | admin | 'z3FP6Cyq62' | active |
+-----------------------+-------+--------------+--------+
Connect to grafana ok
+------------------------------------------------------------------+
|                             grafana                              |
+-----------------------------------+-------+-------------+--------+
| url                               | user  | password    | status |
+-----------------------------------+-------+-------------+--------+
| http://127.0.1.1:3000/d/oceanbase | admin | 'oceanbase' | active |
+-----------------------------------+-------+-------------+--------+
Trace ID: 453e48e6-0802-11f1-91ab-000c29d2c599
If you want to view detailed obd logs, please run: obd display-trace 453e48e6-0802-11f1-91ab-000c29d2c599
马德龙
#6
求解,obshell Dashboard 的密码没改过,但是今天登陆不上去了
马德龙
#7
2026-02-12T12:57:00.443 INFO  [2478017] [f444501fdc0aba73] [common/middleware.go:670] verfiy request: /api/v1/ob/info
2026-02-12T12:57:00.443 WARN  [2478017] [F000000000000000] [secure/auth.go:50] auth expired at: 1770874594, current: 1770901020
2026-02-12T12:57:00.443 ERROR [2478017] [f444501fdc0aba73] [common/middleware.go:546] Security verification failed: Authentication expired
2026-02-12T12:57:00.443 INFO  [2478017] [f444501fdc0aba73] [common/middleware.go:347] API response error: [GET /api/v1/ob/info, client=192.168.101.128, traceId=f444501fdc0aba73, duration=0, status=401,data=<nil>, error={Code:Security.Authentication.Expired, Message:认证失败: 认证信息已过期}]
马德龙
#8
主要是密码没有修改过,这个密码失效的机制是OceanBase自带的么?
淇铭
#9
确认一下浏览器所在主机和obshell服务所在主机的时钟差
1 个赞
马德龙
#10
感谢大佬,被运维坑了,时区不对,我去打他去。。。。。。