烂笔头
2025 年11 月 14 日 16:25
#1
【 使用环境 】测试环境
【备注】基于 LLM 和开源文档 RAG 的论坛小助手已开放测试,在发帖时输入 [
@论坛小助手 ] 即可召唤小助手,欢迎试用!
辞霜
2025 年11 月 14 日 16:49
#4
obd的版本是多少。麻烦提供一份obd的详细日志~/.obd/log
烂笔头
2025 年11 月 14 日 17:09
#5
烂笔头
2025 年11 月 14 日 17:10
#6
[root@localhost .obd]$ obd --versionhttps://www.apache.org/licenses/LICENSE-2.0 .
烂笔头
2025 年11 月 14 日 17:14
#7
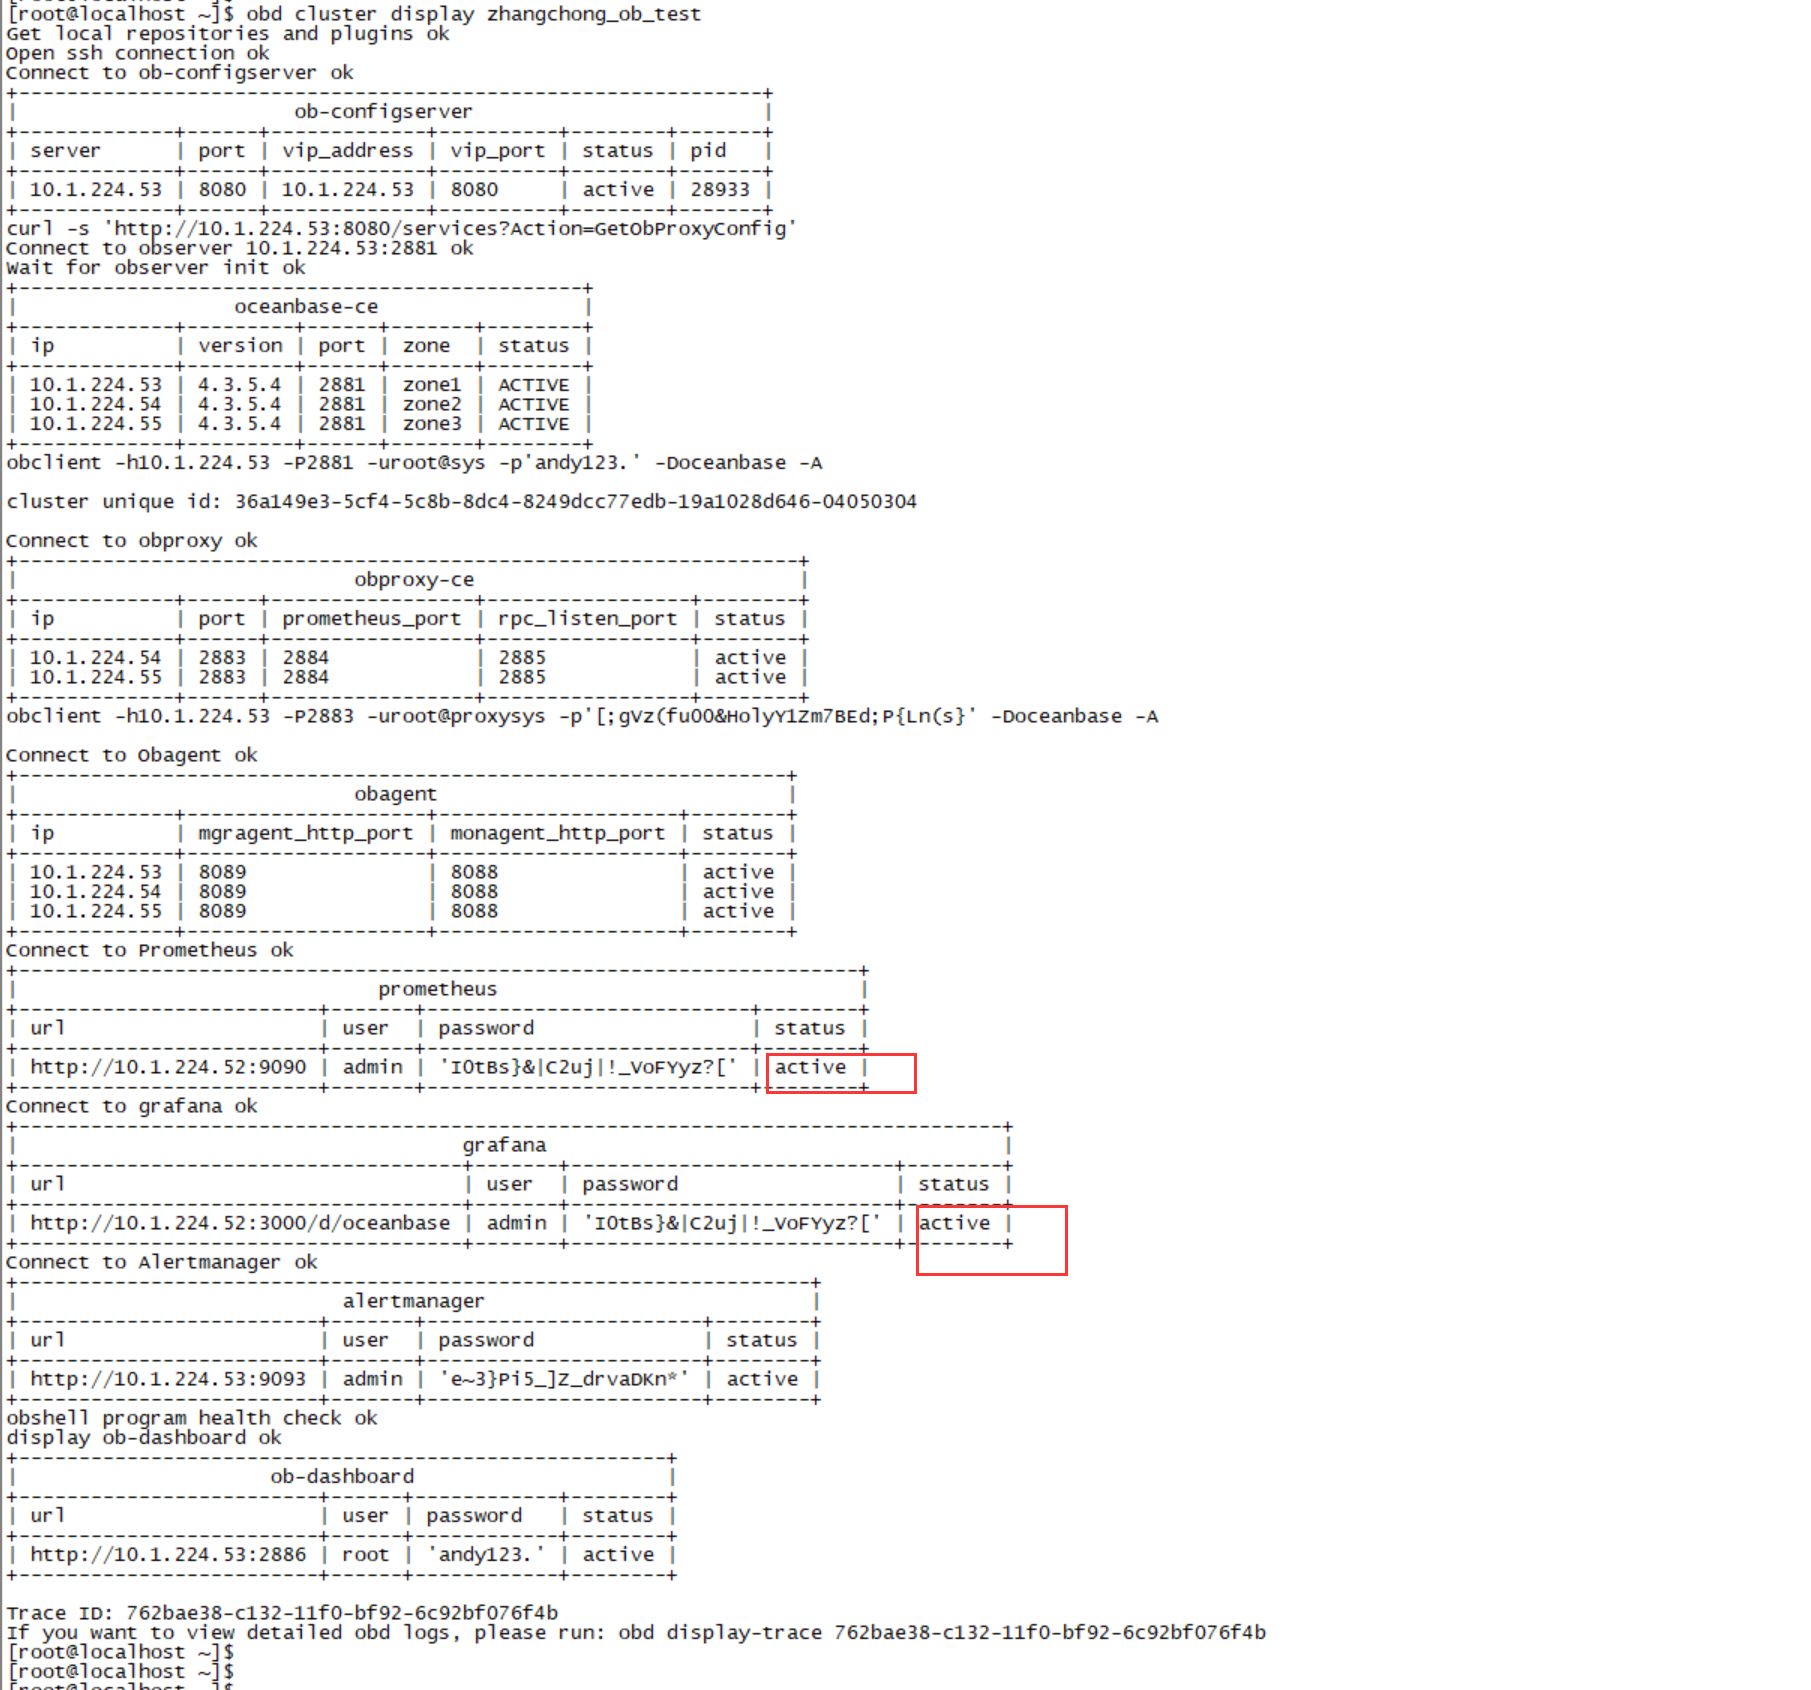
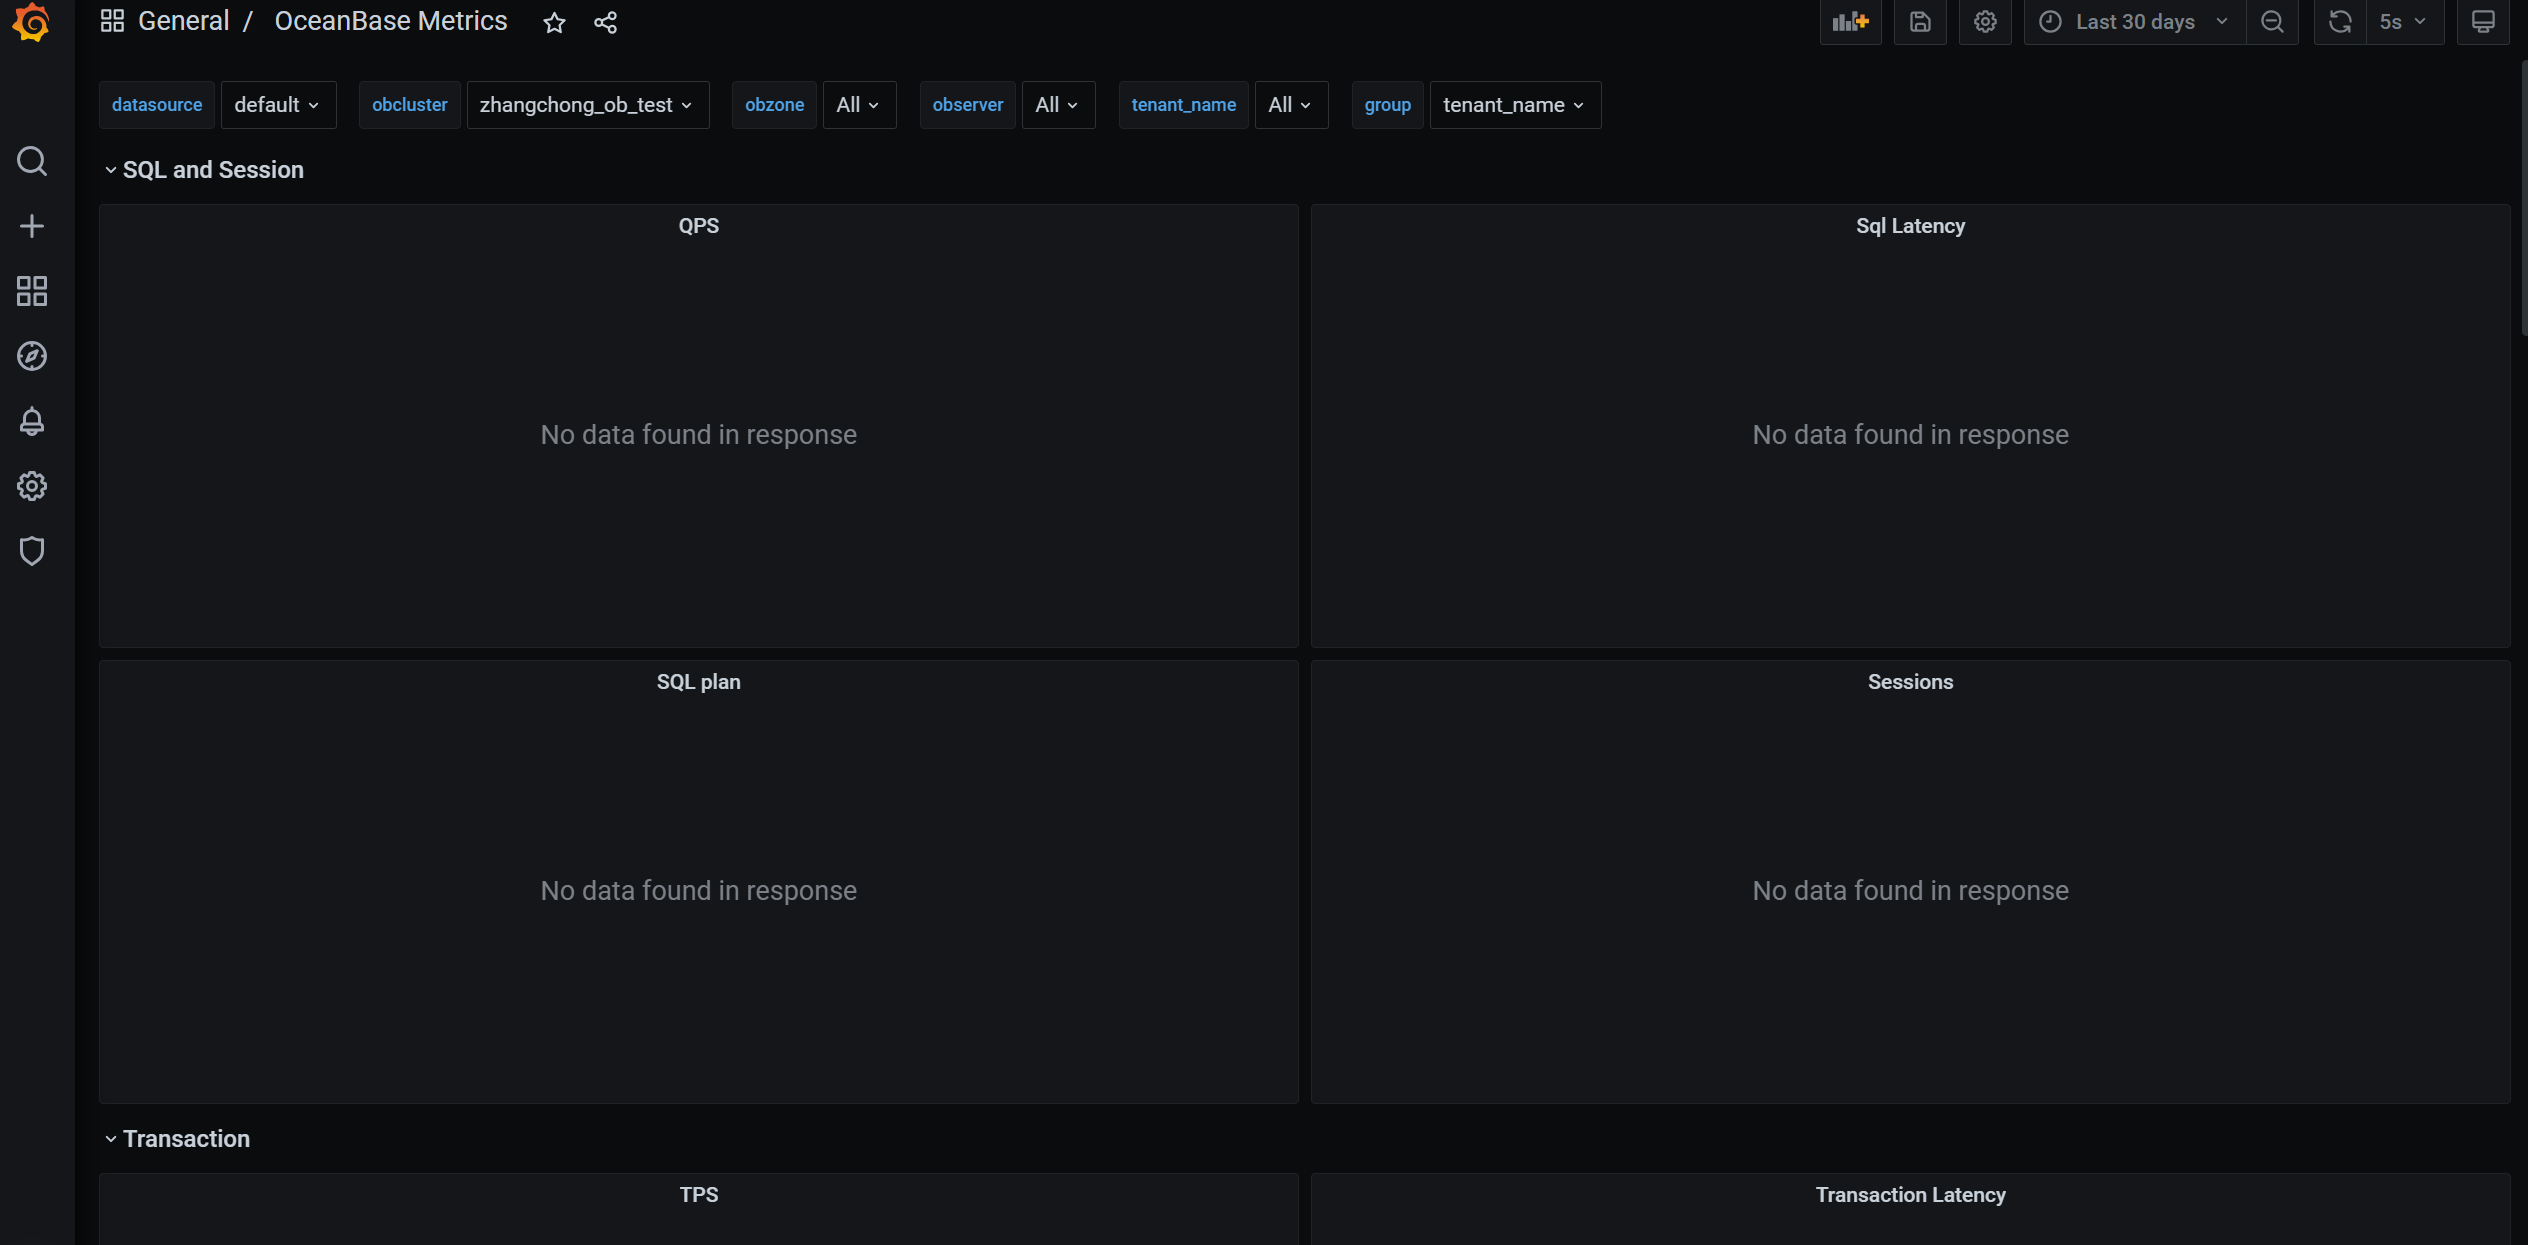
集群是2025-10-23 16:21:40创建成功的。今天想看grafana监控发现数据没有显示
辞霜
2025 年11 月 14 日 17:16
#8
之前数据有显示过么。麻烦确认下obagent的版本是多少
烂笔头
2025 年11 月 14 日 17:31
#10
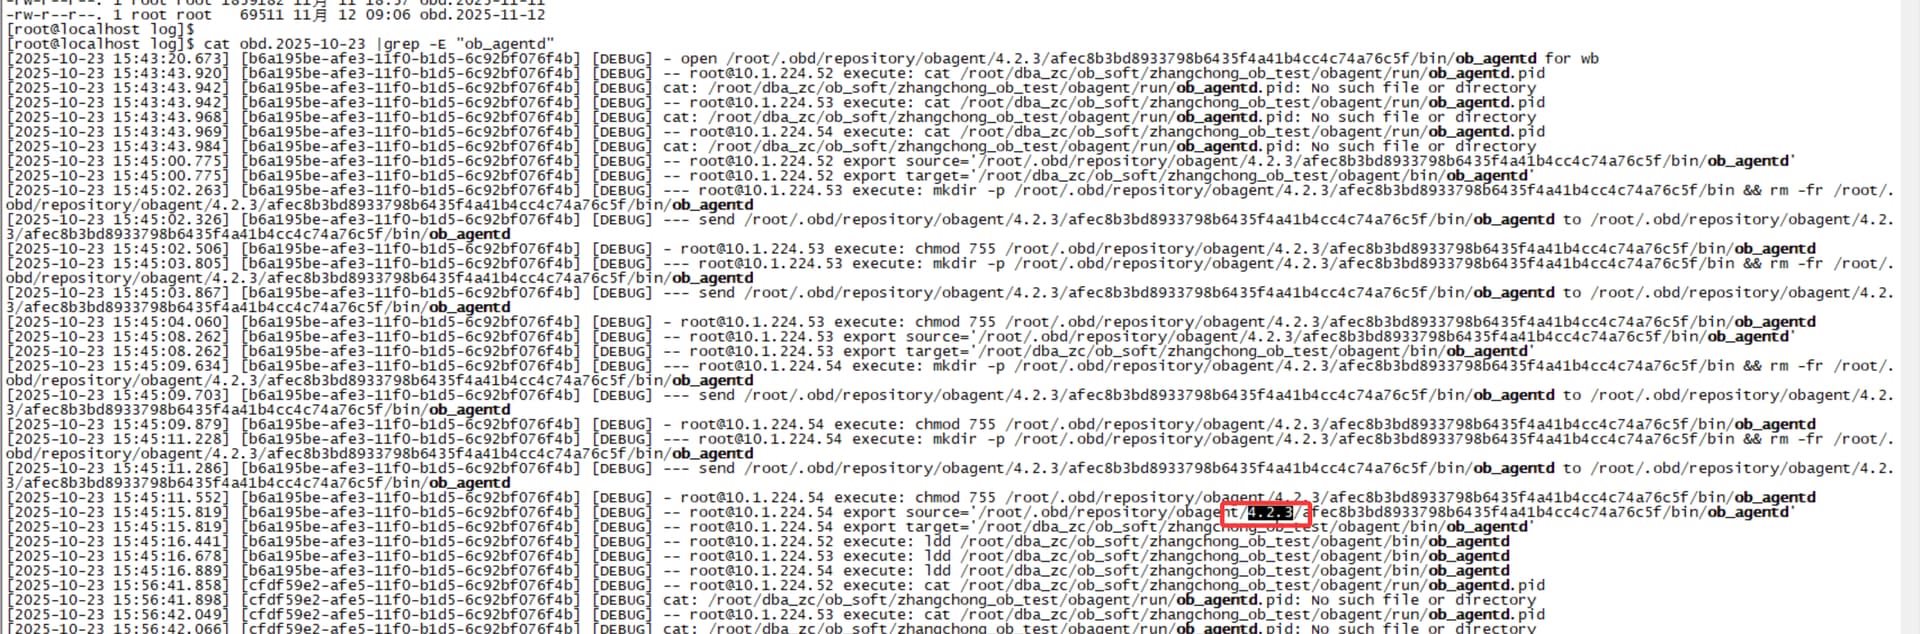
之前没有看grafana不确定是不是可以。但是我没动过相关配置。命令我不知道怎么查看,查的日志,好像版本是 4.2.3
辞霜
2025 年11 月 19 日 17:29
#11
你好当前问题还存在么。麻烦提供一下集群的yaml文件
烂笔头
2025 年11 月 20 日 17:30
#12
[root@localhost zhangchong_ob_test]$ pwd
10.1.224.53
10.1.224.54
10.1.224.55
ob-configserver
10.1.224.53
10.1.224.54
10.1.224.55
oceanbase-ce
ob-configserver
10.1.224.53
10.1.224.54
10.1.224.55
oceanbase-ce
10.1.224.53
10.1.224.52
obagent
10.1.224.52
prometheus
10.1.224.53
mock_webhookhttp://127.0.0.1:5001/
prometheus
辞霜
2025 年11 月 20 日 18:18
#13
烂笔头
2025 年11 月 20 日 18:43
#14
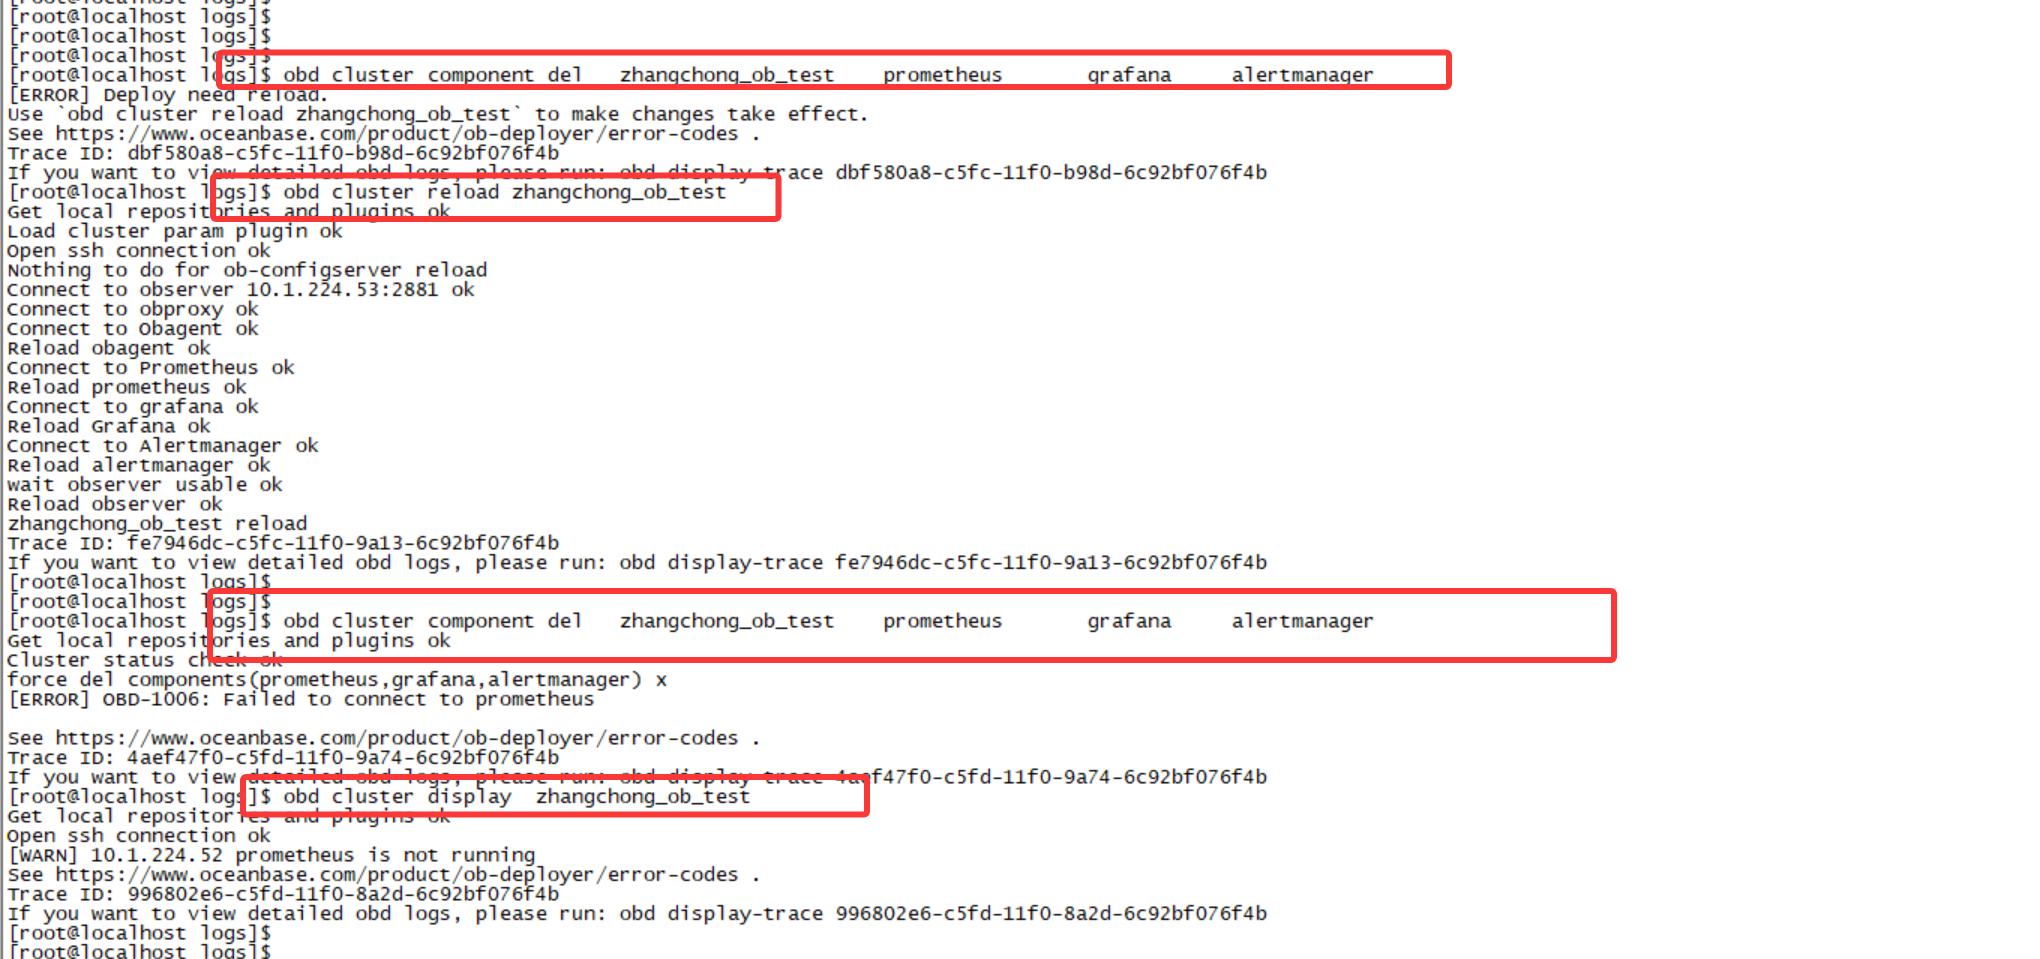
具体删除哪些组件?
辞霜
2025 年11 月 21 日 09:48
#17
你是否手动修改过yaml文件。正常情况不需要让你执行reload的
烂笔头
2025 年11 月 24 日 14:57
#18
obd.tar.gz (171.6 KB)
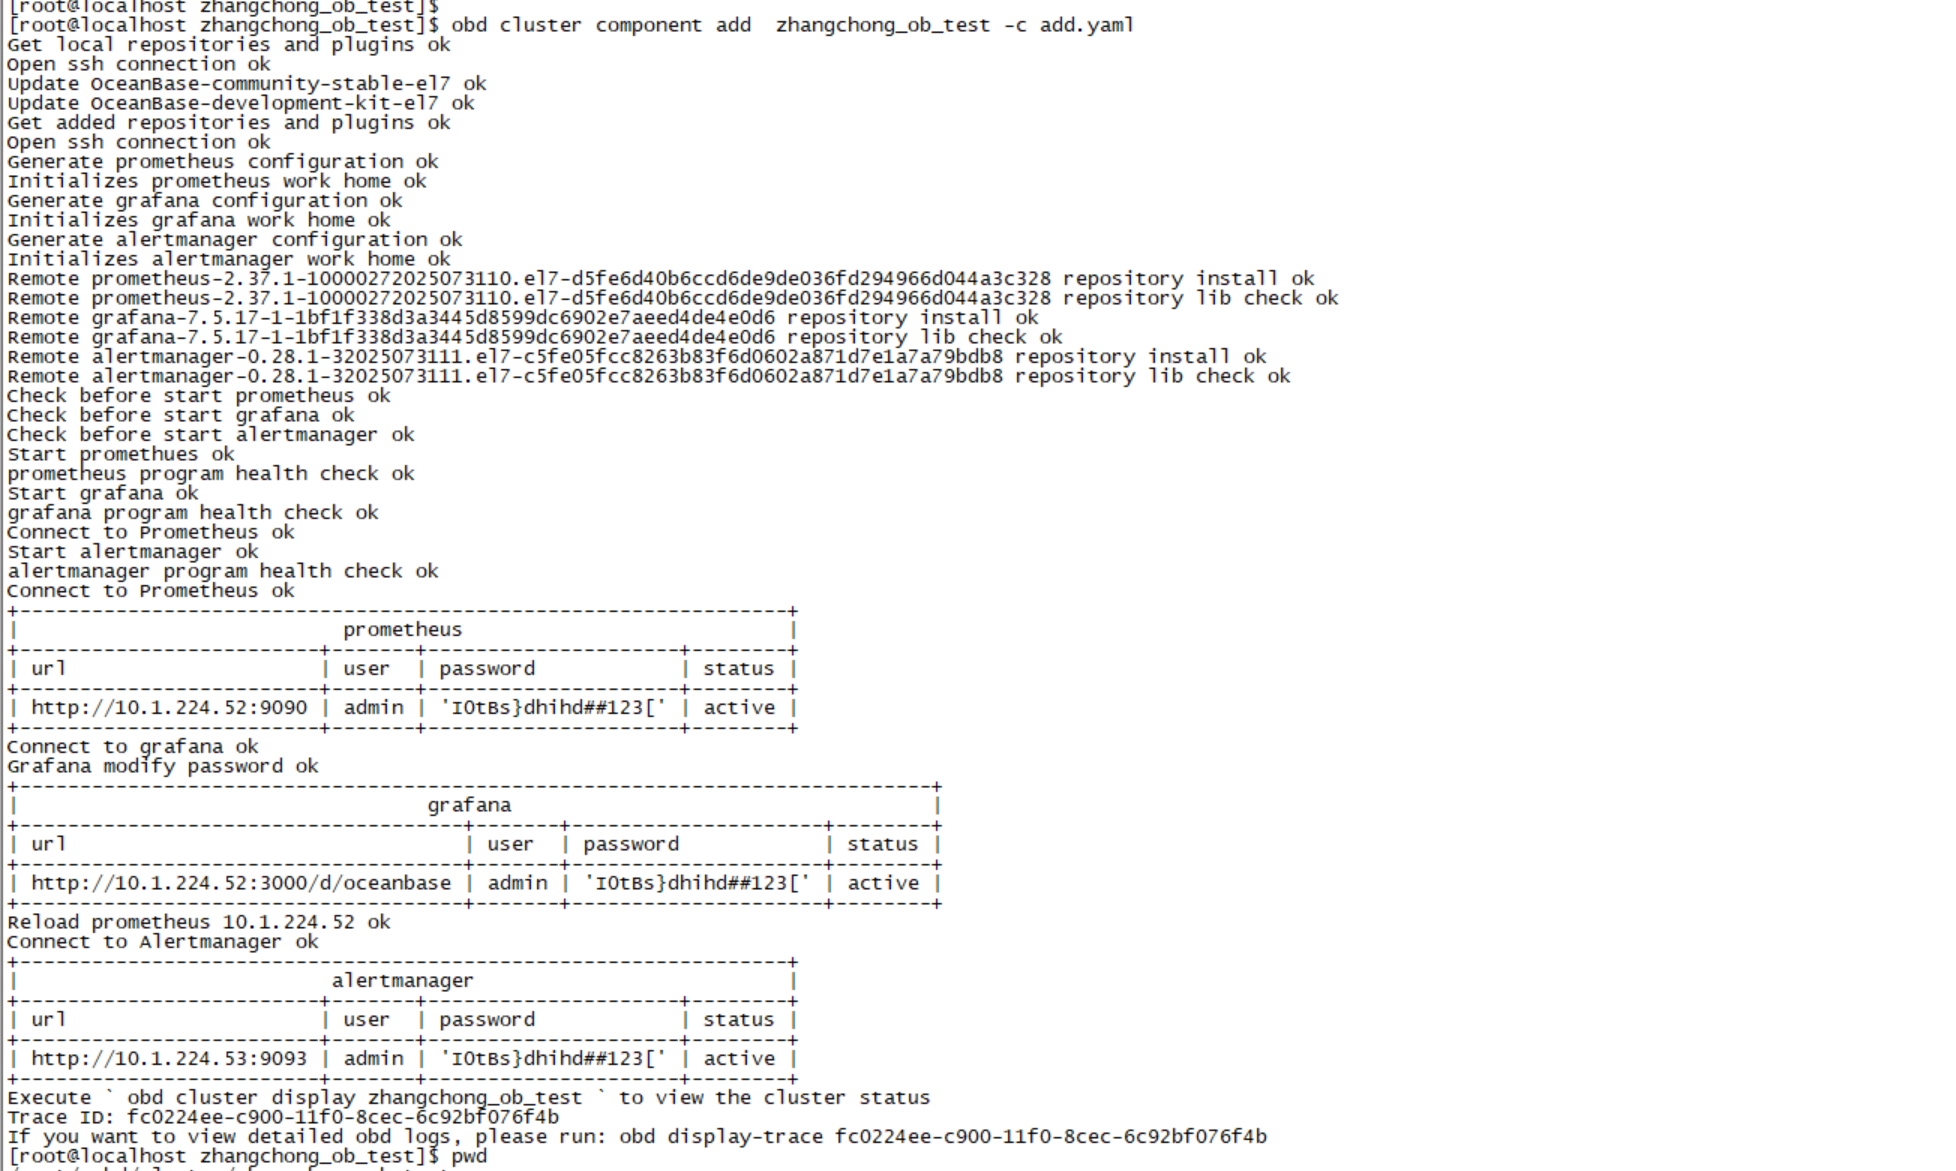
卸载组件并重新安装组件,grafana还是显示不出数据
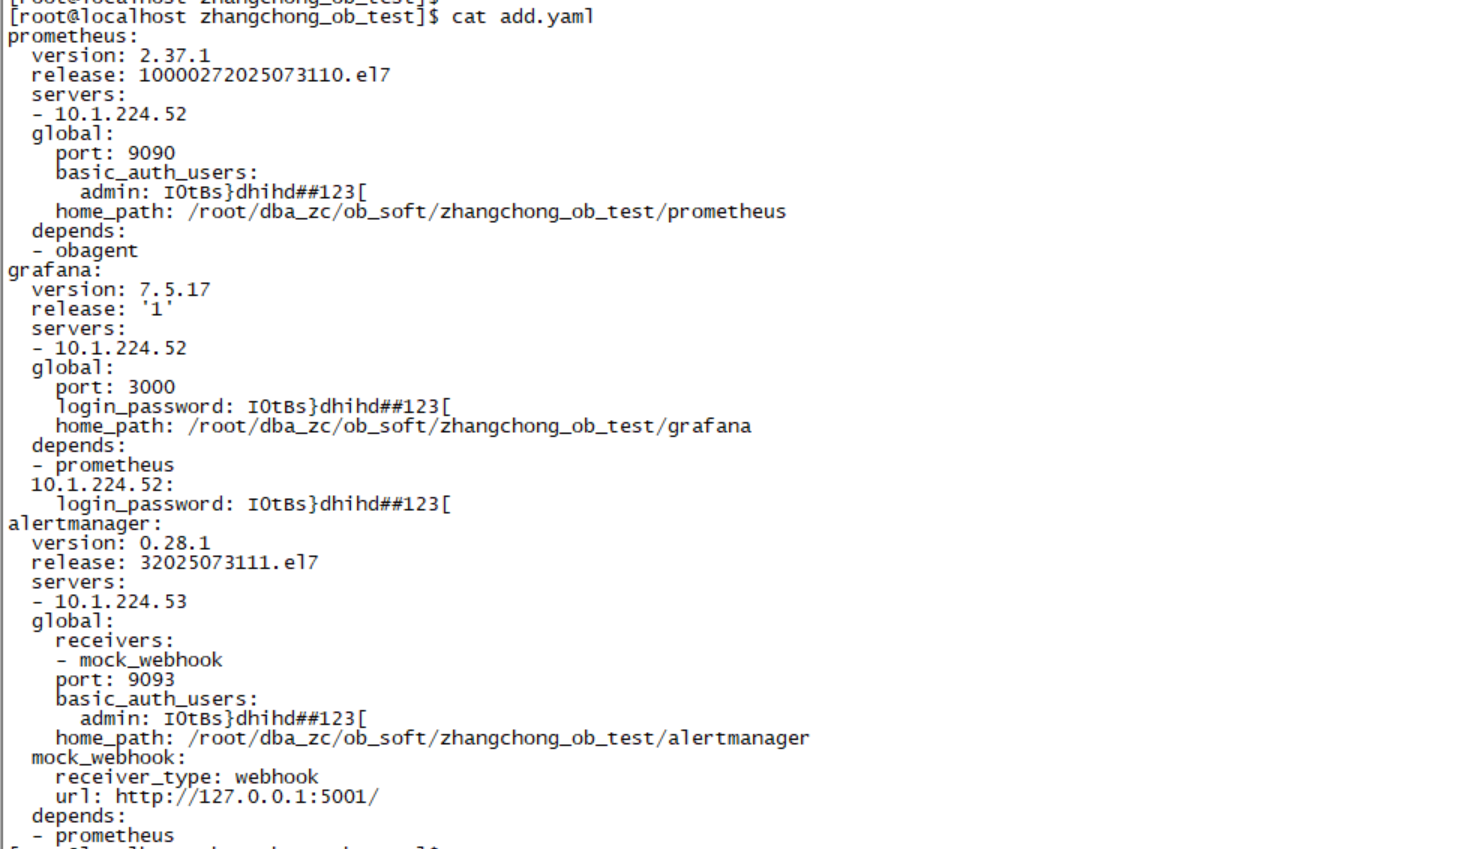
obd cluster component add zhangchong_ob_test -c add.yaml