【 使用环境 】 测试环境
【 OB or 其他组件 】4.2.5.5
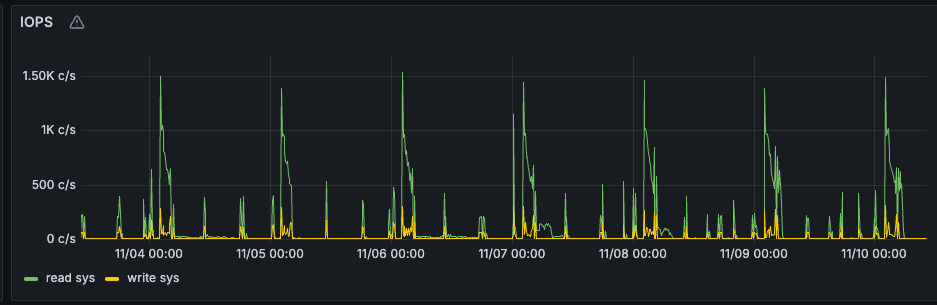
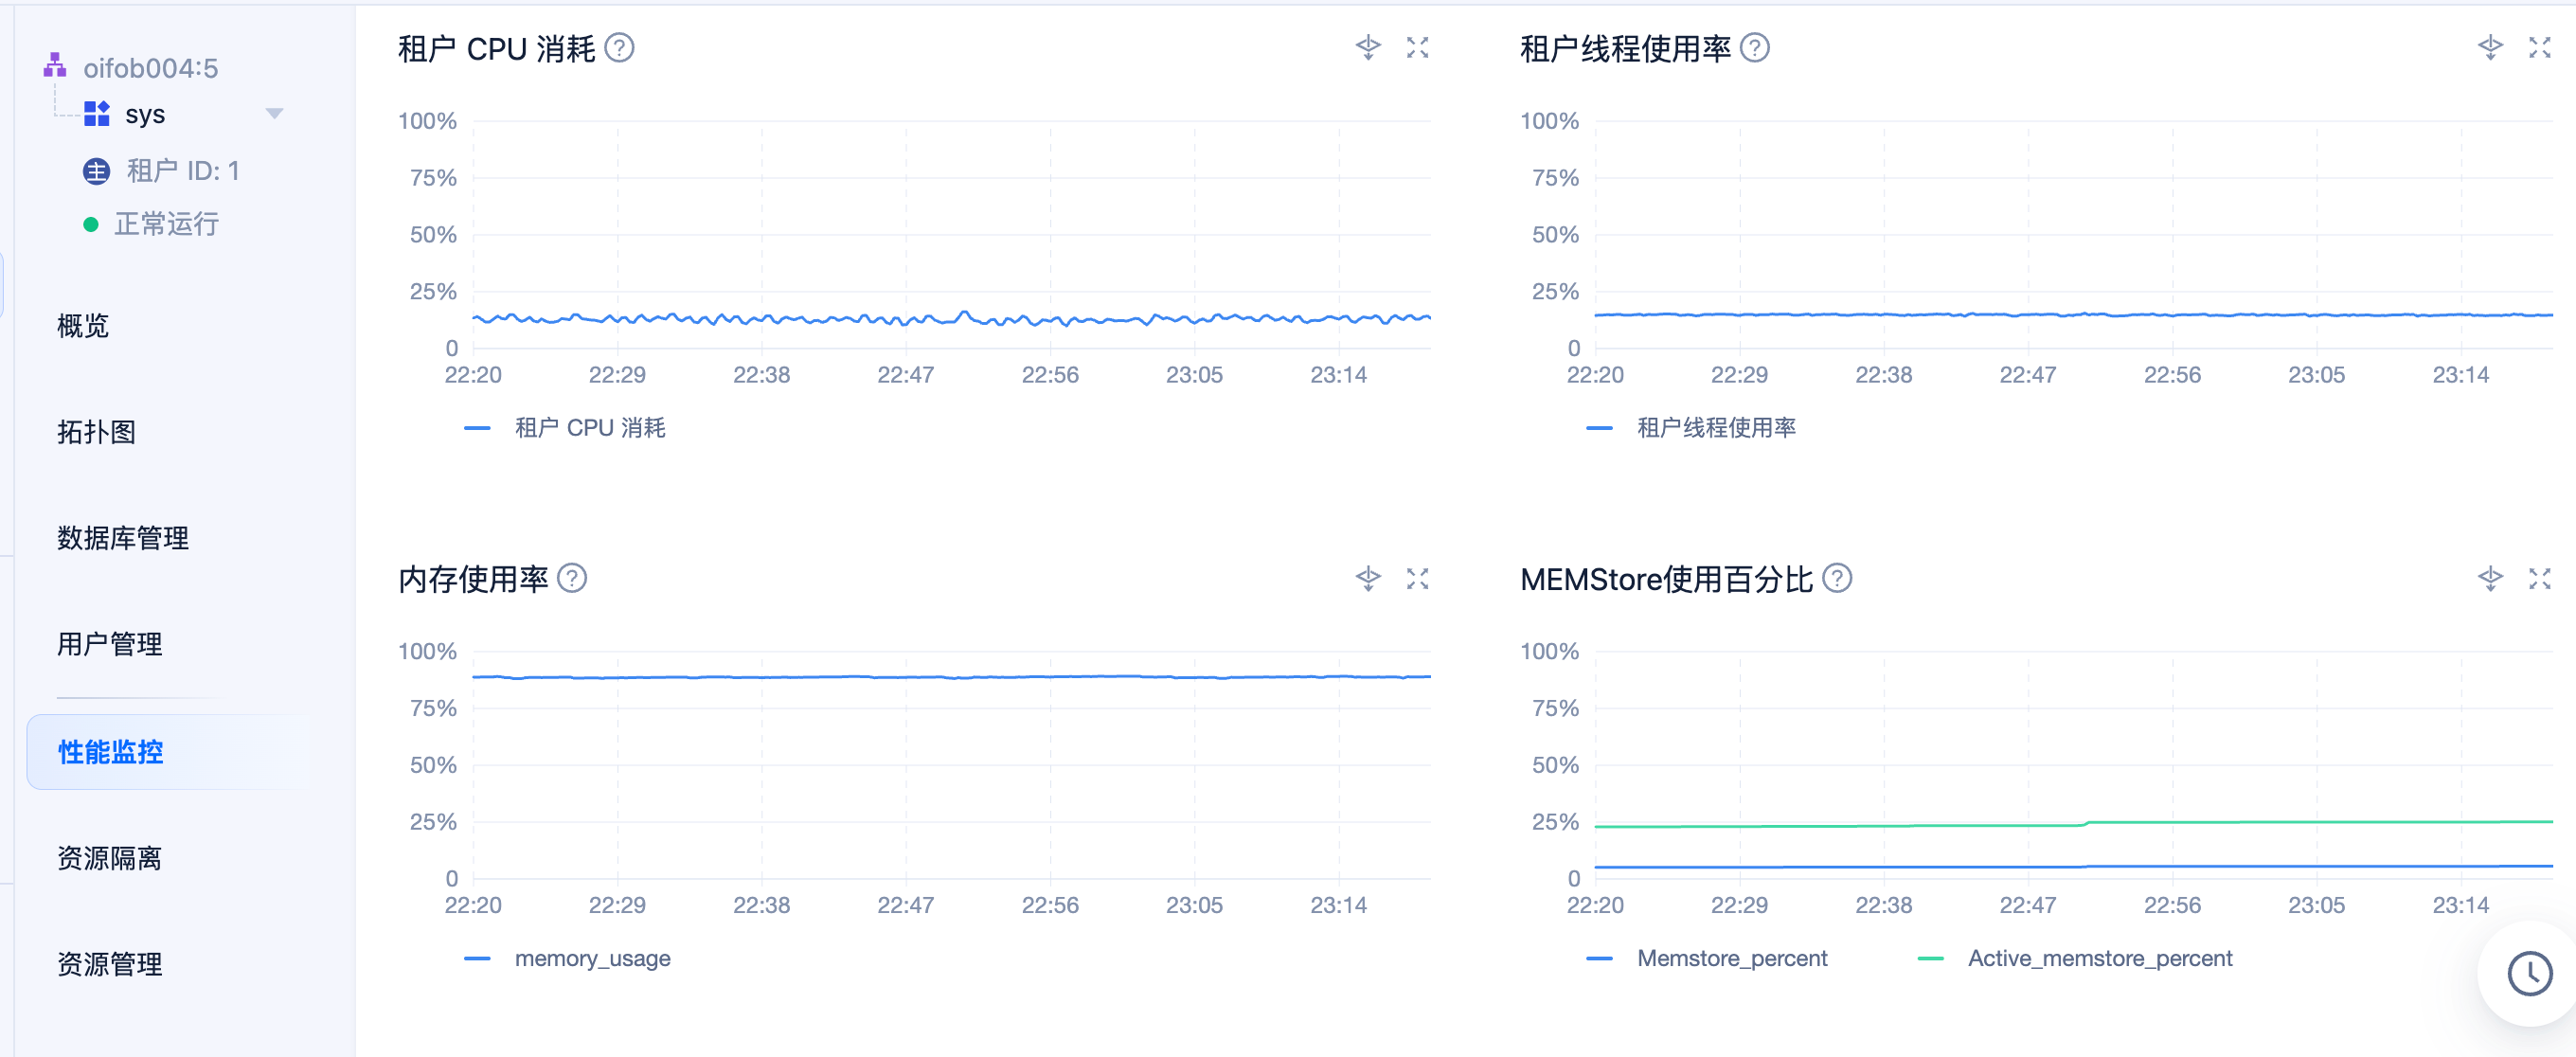
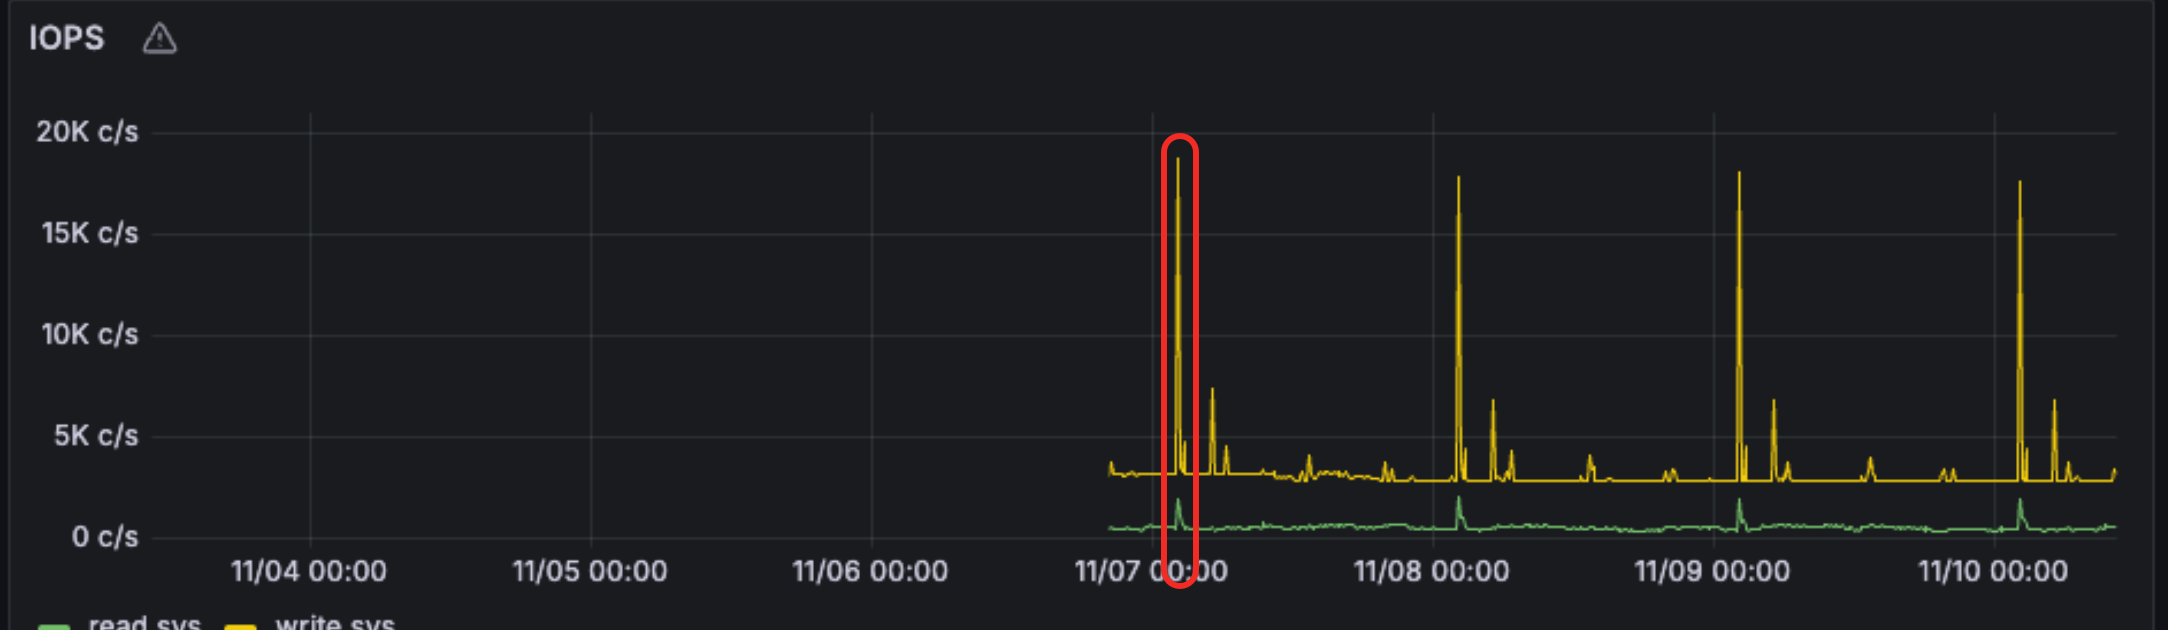
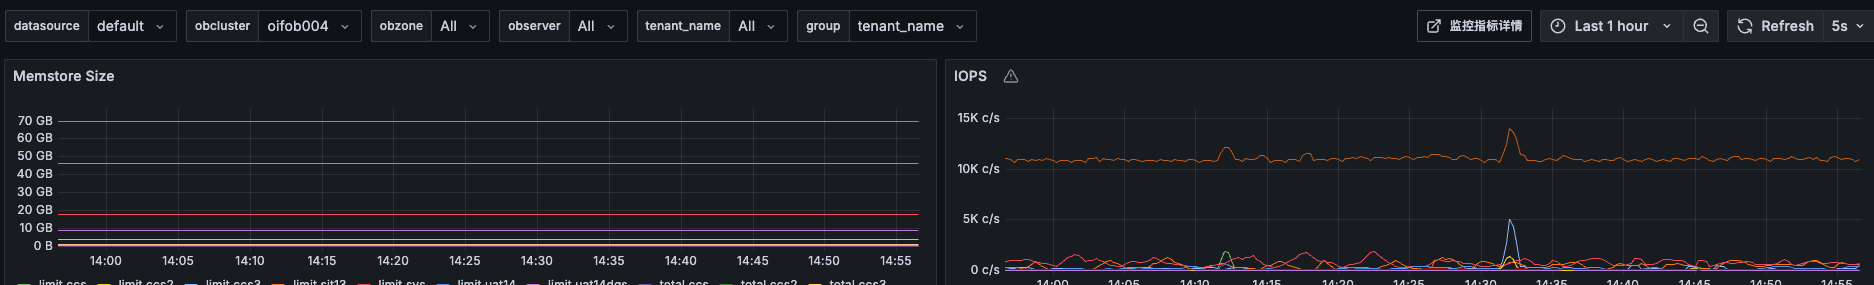
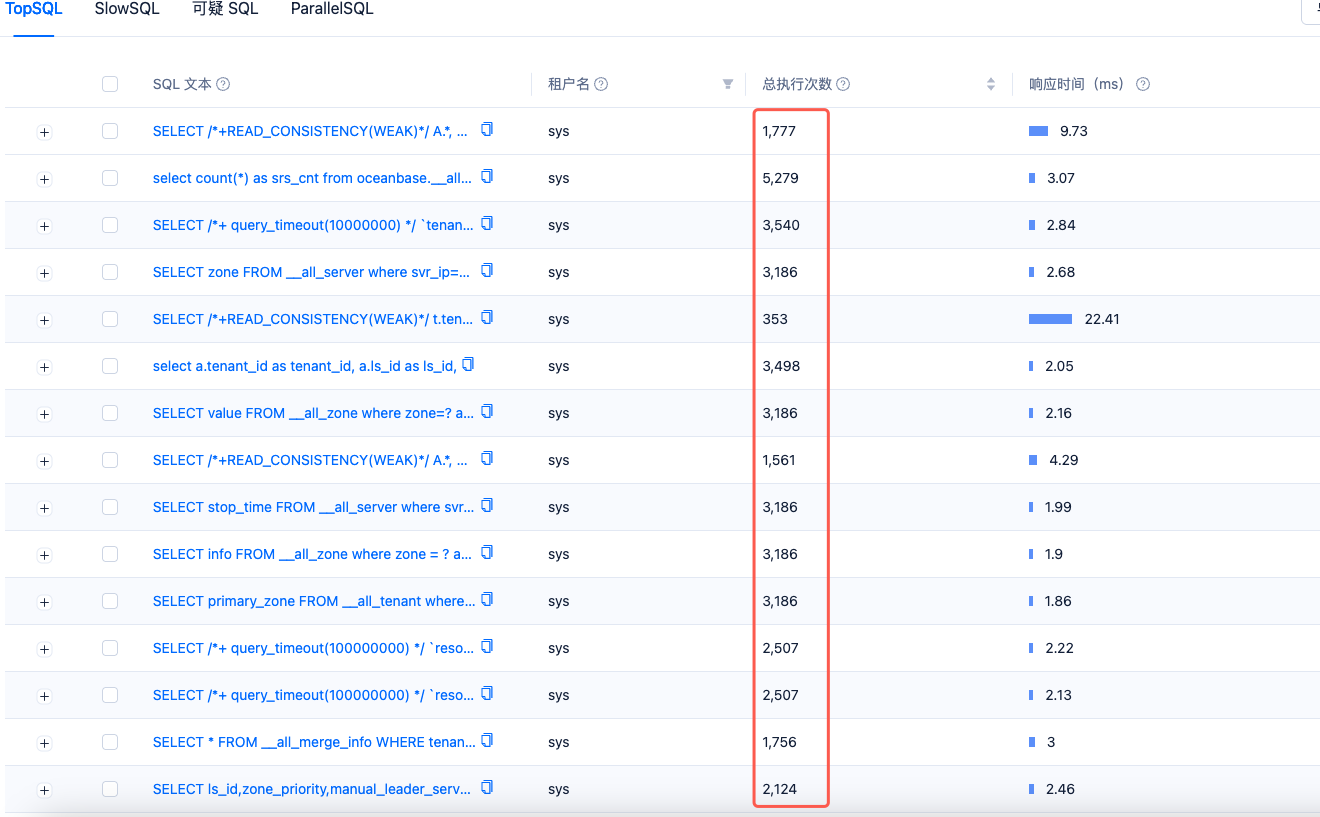
【问题描述】sys租户的iops特别高导致操作系统的io使用率特别高,但是生产环境4.2.1.3的版本的sys的量却特别的少,在write的sys特别的明显
【附件及日志】
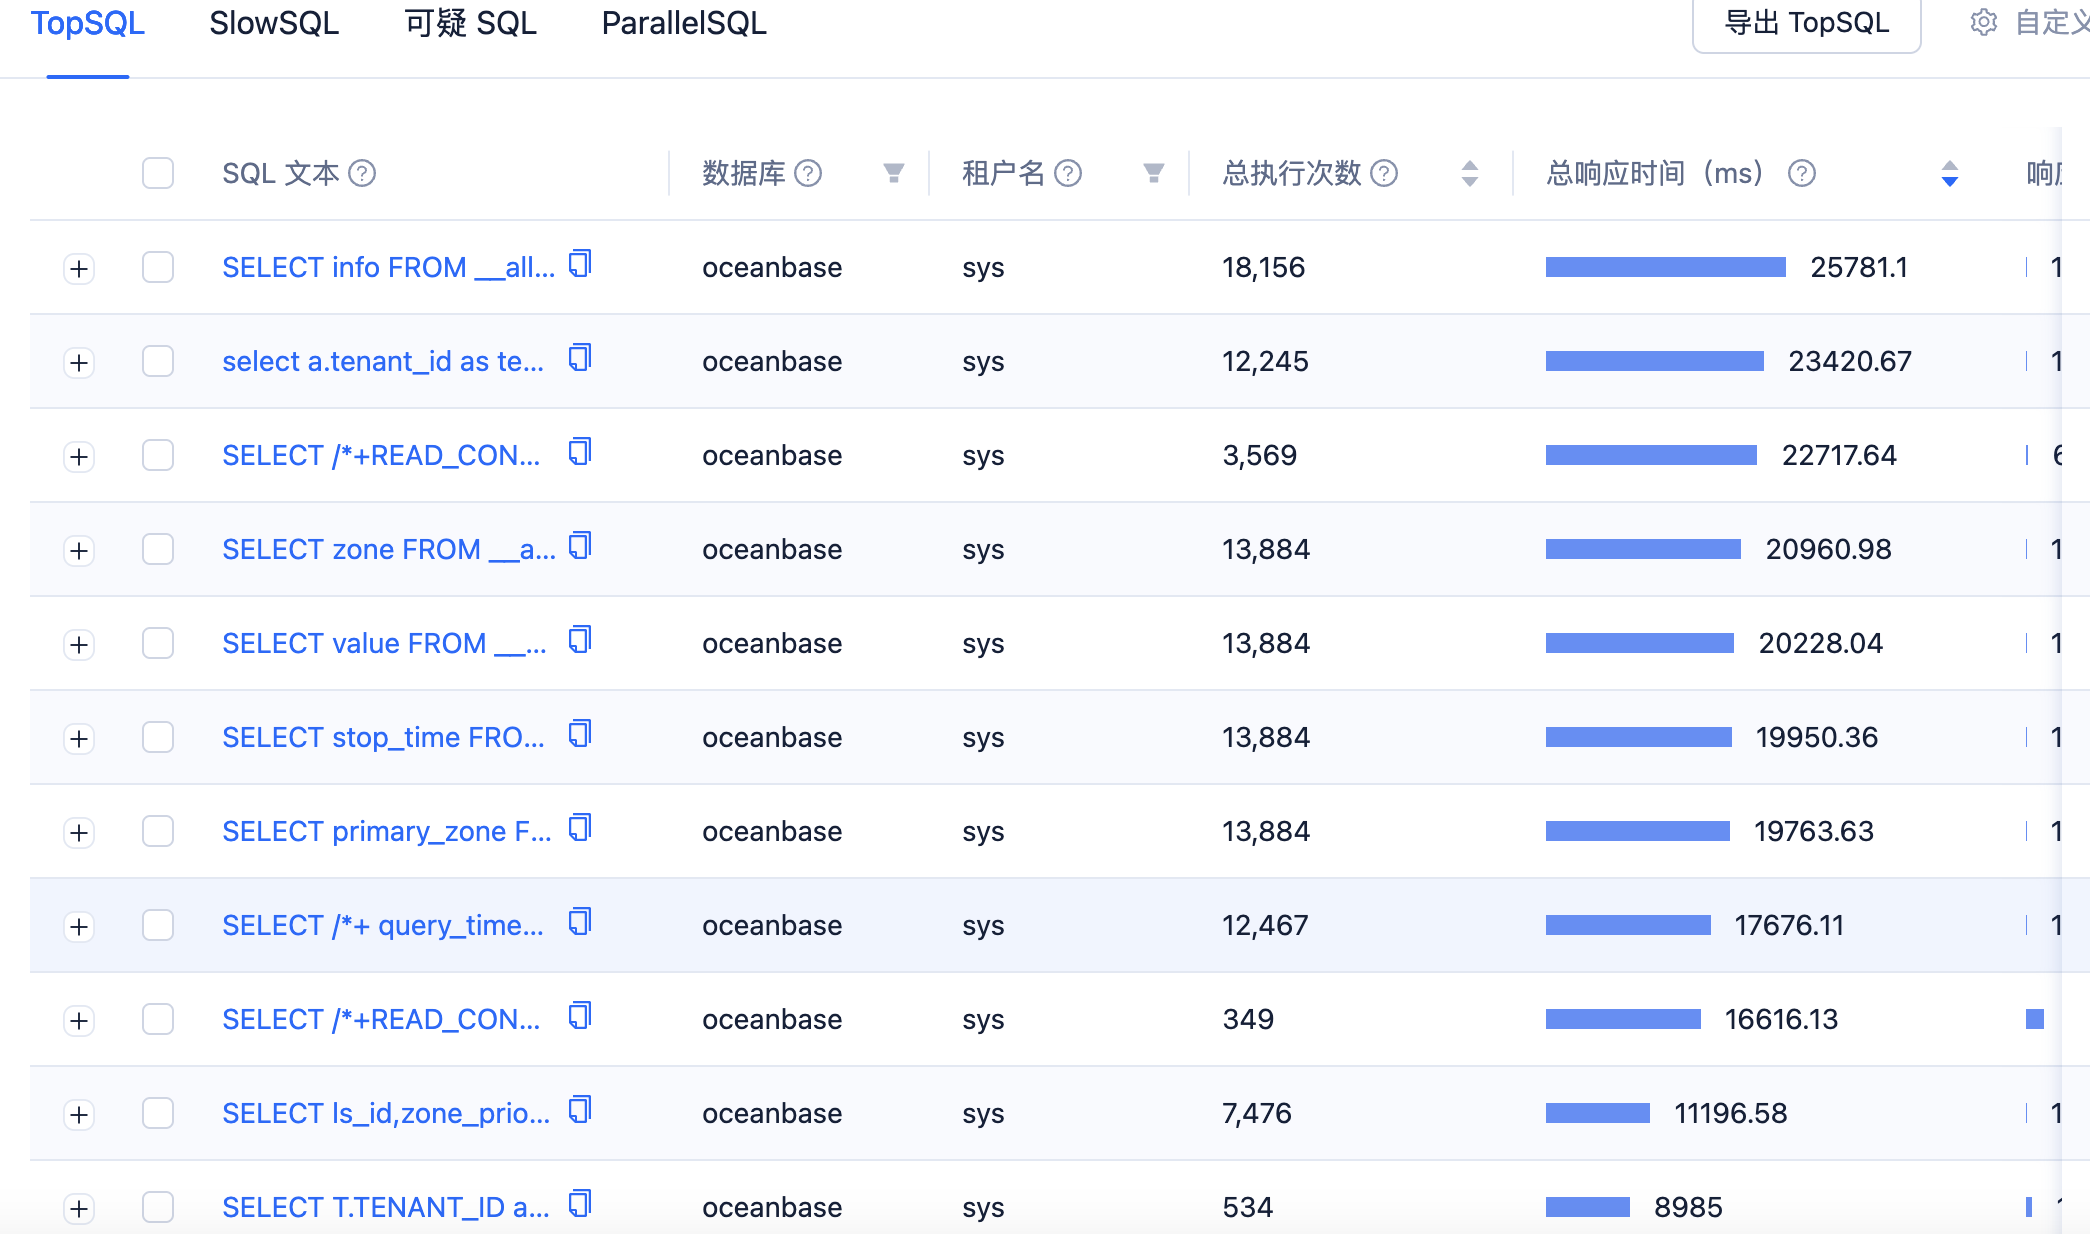
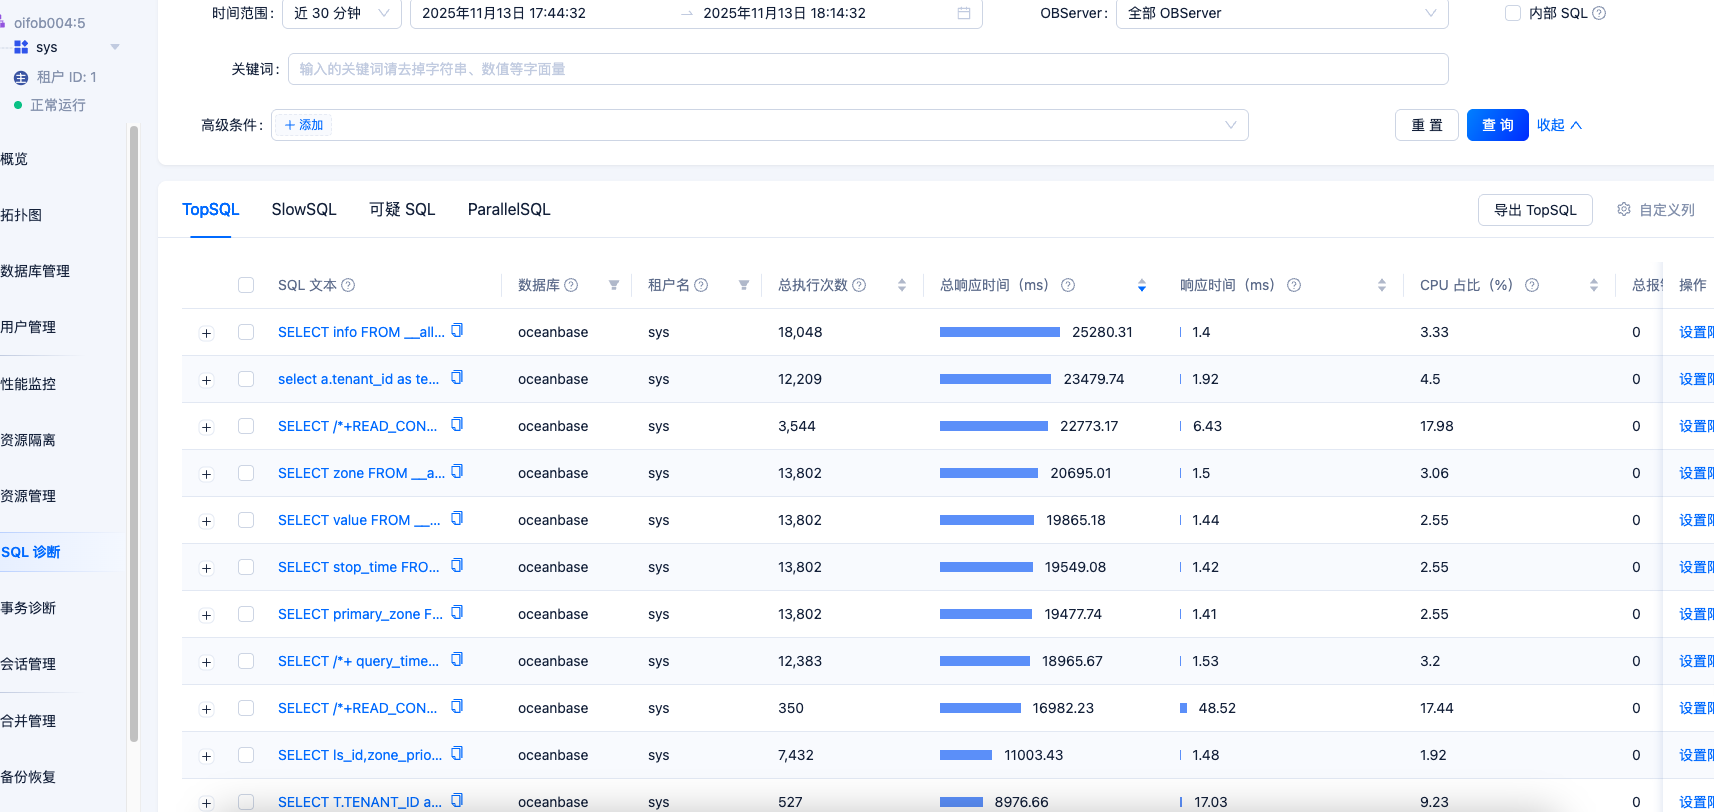
这是测试环境4.2.5.5的iops和请求的sql量

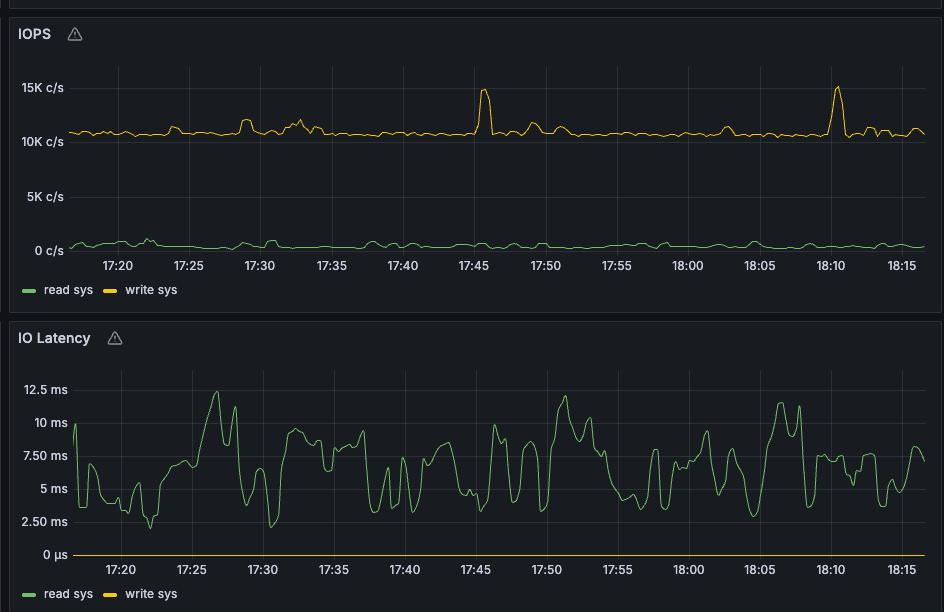
下面是生产环境的4.2.1.3版本的sys量却特别的少
【 使用环境 】 测试环境
【 OB or 其他组件 】4.2.5.5
【问题描述】sys租户的iops特别高导致操作系统的io使用率特别高,但是生产环境4.2.1.3的版本的sys的量却特别的少,在write的sys特别的明显
【附件及日志】
这是测试环境4.2.5.5的iops和请求的sql量
下面是生产环境的4.2.1.3版本的sys量却特别的少
SHOW VARIABLES like ‘version_comment’;具体的版本号查一下
show parameters where name in (‘memory_limit’,‘memory_limit_percentage’,‘system_memory’,‘log_disk_size’,‘log_disk_percentage’,‘datafile_size’,‘datafile_disk_percentage’);
select zone,concat(SVR_IP,’:’,SVR_PORT) observer,
cpu_capacity_max cpu_total,cpu_assigned_max cpu_assigned,
cpu_capacity-cpu_assigned_max as cpu_free,
round(memory_limit/1024/1024/1024,2) as memory_total,
round((memory_limit-mem_capacity)/1024/1024/1024,2) as system_memory,
round(mem_assigned/1024/1024/1024,2) as mem_assigned,
round((mem_capacity-mem_assigned)/1024/1024/1024,2) as memory_free,
round(log_disk_capacity/1024/1024/1024,2) as log_disk_capacity,
round(log_disk_assigned/1024/1024/1024,2) as log_disk_assigned,
round((log_disk_capacity-log_disk_assigned)/1024/1024/1024,2) as log_disk_free,
round((data_disk_capacity/1024/1024/1024),2) as data_disk,
round((data_disk_in_use/1024/1024/1024),2) as data_disk_used,
round((data_disk_capacity-data_disk_in_use)/1024/1024/1024,2) as data_disk_free
from oceanbase.gv$ob_servers;
select a.zone,a.svr_ip,b.tenant_name,b.tenant_type, a.max_cpu, a.min_cpu,
round(a.memory_size/1024/1024/1024,2) memory_size_gb,
round(a.log_disk_size/1024/1024/1024,2) log_disk_size,
round(a.log_disk_in_use/1024/1024/1024,2) log_disk_in_use,
round(a.data_disk_in_use/1024/1024/1024,2) data_disk_in_use
from oceanbase.gv$ob_units a join oceanbase.dba_ob_tenants b on a.tenant_id=b.tenant_id order by b.tenant_name;
–上面的几个信息查一下
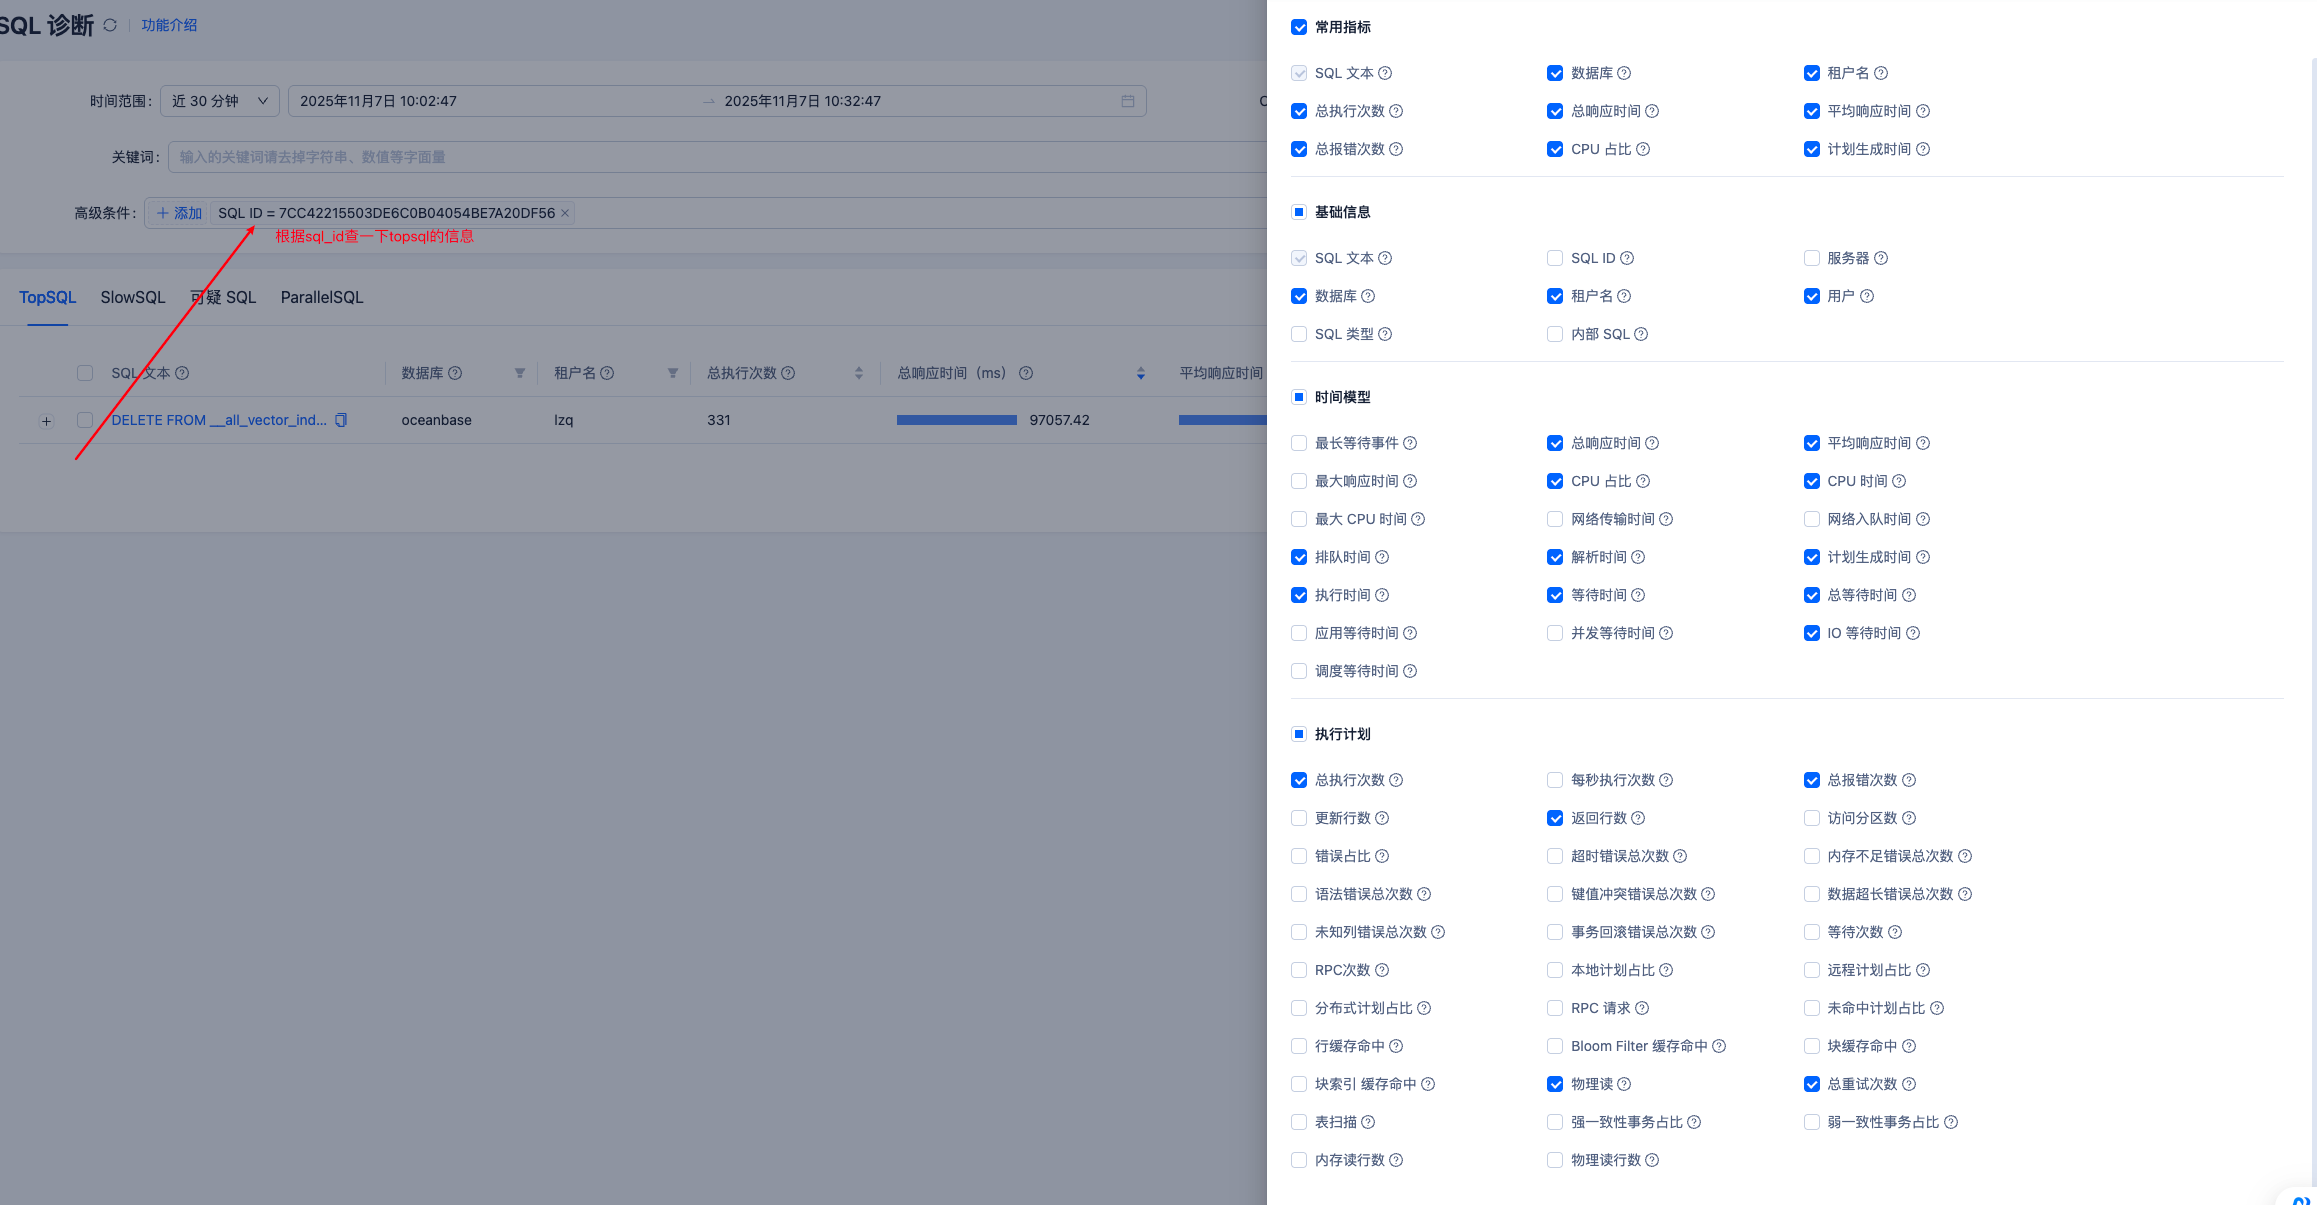
看着有一条语句的查询cpu的占比很高 查一下这个语句topsql信息
mysql> show variables like ‘version_comment’;
| Variable_name | Value |
| version_comment | OceanBase_CE 4.2.5.5 (r105000032025071717-5a7fbc0449701109376a16260785c61c36989d8e) (Built Jul 17 2025 18:24:11) |
1 row in set (0.04 sec)
show parameters where name in (‘memory_limit’,‘memory_limit_percentage’,‘system_memory’,‘log_disk_size’,‘log_disk_percentage’,‘datafile_size’,‘datafile_disk_percentage’) \G;
*************************** 1. row ***************************
zone: zone3
svr_type: observer
svr_ip: 10.0.2.110
svr_port: 2882
name: log_disk_percentage
data_type: NULL
value: 0
info: the percentage of disk space used by the log files. Range: [0,99] in integer;only effective when parameter log_disk_size is 0;when log_disk_percentage is 0: a) if the data and the log are on the same disk, means log_disk_percentage = 30 b) if the data and the log are on the different disks, means log_disk_perecentage = 90
section: LOGSERVICE
scope: CLUSTER
source: DEFAULT
edit_level: DYNAMIC_EFFECTIVE
default_value: 0
isdefault: 1
*************************** 2. row ***************************
zone: zone3
svr_type: observer
svr_ip: 10.0.2.110
svr_port: 2882
name: log_disk_size
data_type: NULL
value: 0M
info: the size of disk space used by the log files. Range: [0, +∞)
section: LOGSERVICE
scope: CLUSTER
source: DEFAULT
edit_level: DYNAMIC_EFFECTIVE
default_value: 0M
isdefault: 1
*************************** 3. row ***************************
zone: zone3
svr_type: observer
svr_ip: 10.0.2.110
svr_port: 2882
name: memory_limit_percentage
data_type: NULL
value: 80
info: the size of the memory reserved for internal use(for testing purpose). Range: [10, 95]
section: OBSERVER
scope: CLUSTER
source: DEFAULT
edit_level: DYNAMIC_EFFECTIVE
default_value: 80
isdefault: 1
*************************** 4. row ***************************
zone: zone3
svr_type: observer
svr_ip: 10.0.2.110
svr_port: 2882
name: system_memory
data_type: NULL
value: 0M
info: the memory reserved for internal use which cannot be allocated to any outer-tenant, and should be determined to guarantee every server functions normally. Range: [0M,)
section: OBSERVER
scope: CLUSTER
source: DEFAULT
edit_level: DYNAMIC_EFFECTIVE
default_value: 0M
isdefault: 1
*************************** 5. row ***************************
zone: zone3
svr_type: observer
svr_ip: 10.0.2.110
svr_port: 2882
name: memory_limit
data_type: NULL
value: 0M
info: the size of the memory reserved for internal use(for testing purpose), 0 means follow memory_limit_percentage. Range: 0, [1G,).
section: OBSERVER
scope: CLUSTER
source: DEFAULT
edit_level: DYNAMIC_EFFECTIVE
default_value: 0M
isdefault: 1
*************************** 6. row ***************************
zone: zone3
svr_type: observer
svr_ip: 10.0.2.110
svr_port: 2882
name: datafile_disk_percentage
data_type: NULL
value: 0
info: the percentage of disk space used by the data files. Range: [0,99] in integer
section: SSTABLE
scope: CLUSTER
source: DEFAULT
edit_level: DYNAMIC_EFFECTIVE
default_value: 0
isdefault: 1
*************************** 7. row ***************************
zone: zone3
svr_type: observer
svr_ip: 10.0.2.110
svr_port: 2882
name: datafile_size
data_type: NULL
value: 0M
info: size of the data file. Range: [0, +∞)
section: SSTABLE
scope: CLUSTER
source: DEFAULT
edit_level: DYNAMIC_EFFECTIVE
default_value: 0M
isdefault: 1
*************************** 8. row ***************************
zone: zone1
svr_type: observer
svr_ip: 10.0.2.108
svr_port: 2882
name: log_disk_percentage
data_type: NULL
value: 0
info: the percentage of disk space used by the log files. Range: [0,99] in integer;only effective when parameter log_disk_size is 0;when log_disk_percentage is 0: a) if the data and the log are on the same disk, means log_disk_percentage = 30 b) if the data and the log are on the different disks, means log_disk_perecentage = 90
section: LOGSERVICE
scope: CLUSTER
source: DEFAULT
edit_level: DYNAMIC_EFFECTIVE
default_value: 0
isdefault: 1
*************************** 9. row ***************************
zone: zone1
svr_type: observer
svr_ip: 10.0.2.108
svr_port: 2882
name: log_disk_size
data_type: NULL
value: 0M
info: the size of disk space used by the log files. Range: [0, +∞)
section: LOGSERVICE
scope: CLUSTER
source: DEFAULT
edit_level: DYNAMIC_EFFECTIVE
default_value: 0M
isdefault: 1
*************************** 10. row ***************************
zone: zone1
svr_type: observer
svr_ip: 10.0.2.108
svr_port: 2882
name: memory_limit_percentage
data_type: NULL
value: 80
info: the size of the memory reserved for internal use(for testing purpose). Range: [10, 95]
section: OBSERVER
scope: CLUSTER
source: DEFAULT
edit_level: DYNAMIC_EFFECTIVE
default_value: 80
isdefault: 1
*************************** 11. row ***************************
zone: zone1
svr_type: observer
svr_ip: 10.0.2.108
svr_port: 2882
name: system_memory
data_type: NULL
value: 0M
info: the memory reserved for internal use which cannot be allocated to any outer-tenant, and should be determined to guarantee every server functions normally. Range: [0M,)
section: OBSERVER
scope: CLUSTER
source: DEFAULT
edit_level: DYNAMIC_EFFECTIVE
default_value: 0M
isdefault: 1
*************************** 12. row ***************************
zone: zone1
svr_type: observer
svr_ip: 10.0.2.108
svr_port: 2882
name: memory_limit
data_type: NULL
value: 0M
info: the size of the memory reserved for internal use(for testing purpose), 0 means follow memory_limit_percentage. Range: 0, [1G,).
section: OBSERVER
scope: CLUSTER
source: DEFAULT
edit_level: DYNAMIC_EFFECTIVE
default_value: 0M
isdefault: 1
*************************** 13. row ***************************
zone: zone1
svr_type: observer
svr_ip: 10.0.2.108
svr_port: 2882
name: datafile_disk_percentage
data_type: NULL
value: 0
info: the percentage of disk space used by the data files. Range: [0,99] in integer
section: SSTABLE
scope: CLUSTER
source: DEFAULT
edit_level: DYNAMIC_EFFECTIVE
default_value: 0
isdefault: 1
*************************** 14. row ***************************
zone: zone1
svr_type: observer
svr_ip: 10.0.2.108
svr_port: 2882
name: datafile_size
data_type: NULL
value: 0M
info: size of the data file. Range: [0, +∞)
section: SSTABLE
scope: CLUSTER
source: DEFAULT
edit_level: DYNAMIC_EFFECTIVE
default_value: 0M
isdefault: 1
*************************** 15. row ***************************
zone: zone2
svr_type: observer
svr_ip: 10.0.2.109
svr_port: 2882
name: log_disk_percentage
data_type: NULL
value: 0
info: the percentage of disk space used by the log files. Range: [0,99] in integer;only effective when parameter log_disk_size is 0;when log_disk_percentage is 0: a) if the data and the log are on the same disk, means log_disk_percentage = 30 b) if the data and the log are on the different disks, means log_disk_perecentage = 90
section: LOGSERVICE
scope: CLUSTER
source: DEFAULT
edit_level: DYNAMIC_EFFECTIVE
default_value: 0
isdefault: 1
*************************** 16. row ***************************
zone: zone2
svr_type: observer
svr_ip: 10.0.2.109
svr_port: 2882
name: log_disk_size
data_type: NULL
value: 0M
info: the size of disk space used by the log files. Range: [0, +∞)
section: LOGSERVICE
scope: CLUSTER
source: DEFAULT
edit_level: DYNAMIC_EFFECTIVE
default_value: 0M
isdefault: 1
*************************** 17. row ***************************
zone: zone2
svr_type: observer
svr_ip: 10.0.2.109
svr_port: 2882
name: memory_limit_percentage
data_type: NULL
value: 80
info: the size of the memory reserved for internal use(for testing purpose). Range: [10, 95]
section: OBSERVER
scope: CLUSTER
source: DEFAULT
edit_level: DYNAMIC_EFFECTIVE
default_value: 80
isdefault: 1
*************************** 18. row ***************************
zone: zone2
svr_type: observer
svr_ip: 10.0.2.109
svr_port: 2882
name: system_memory
data_type: NULL
value: 0M
info: the memory reserved for internal use which cannot be allocated to any outer-tenant, and should be determined to guarantee every server functions normally. Range: [0M,)
section: OBSERVER
scope: CLUSTER
source: DEFAULT
edit_level: DYNAMIC_EFFECTIVE
default_value: 0M
isdefault: 1
*************************** 19. row ***************************
zone: zone2
svr_type: observer
svr_ip: 10.0.2.109
svr_port: 2882
name: memory_limit
data_type: NULL
value: 0M
info: the size of the memory reserved for internal use(for testing purpose), 0 means follow memory_limit_percentage. Range: 0, [1G,).
section: OBSERVER
scope: CLUSTER
source: DEFAULT
edit_level: DYNAMIC_EFFECTIVE
default_value: 0M
isdefault: 1
*************************** 20. row ***************************
zone: zone2
svr_type: observer
svr_ip: 10.0.2.109
svr_port: 2882
name: datafile_disk_percentage
data_type: NULL
value: 0
info: the percentage of disk space used by the data files. Range: [0,99] in integer
section: SSTABLE
scope: CLUSTER
source: DEFAULT
edit_level: DYNAMIC_EFFECTIVE
default_value: 0
isdefault: 1
*************************** 21. row ***************************
zone: zone2
svr_type: observer
svr_ip: 10.0.2.109
svr_port: 2882
name: datafile_size
data_type: NULL
value: 0M
info: size of the data file. Range: [0, +∞)
section: SSTABLE
scope: CLUSTER
source: DEFAULT
edit_level: DYNAMIC_EFFECTIVE
default_value: 0M
isdefault: 1
21 rows in set (0.02 sec)
ERROR:
No query specified
mysql> select zone,concat(SVR_IP,’:’,SVR_PORT) observer,
→ cpu_capacity_max cpu_total,cpu_assigned_max cpu_assigned,
→ cpu_capacity-cpu_assigned_max as cpu_free,
→ round(memory_limit/1024/1024/1024,2) as memory_total,
→ round((memory_limit-mem_capacity)/1024/1024/1024,2) as system_memory,
→ round(mem_assigned/1024/1024/1024,2) as mem_assigned,
→ round((mem_capacity-mem_assigned)/1024/1024/1024,2) as memory_free,
→ round(log_disk_capacity/1024/1024/1024,2) as log_disk_capacity,
→ round(log_disk_assigned/1024/1024/1024,2) as log_disk_assigned,
→ round((log_disk_capacity-log_disk_assigned)/1024/1024/1024,2) as log_disk_free,
→ round((data_disk_capacity/1024/1024/1024),2) as data_disk,
→ round((data_disk_in_use/1024/1024/1024),2) as data_disk_used,
→ round((data_disk_capacity-data_disk_in_use)/1024/1024/1024,2) as data_disk_free
→ from oceanbase.gv$ob_servers;
±------±----------------±----------±-------------±---------±---------
| zone | observer | cpu_total | cpu_assigned | cpu_free | memory_total | system_memory | mem_assigned | memory_free | log_disk_capacity | log_disk_assigned | log_disk_free | data_disk | data_disk_used | data_disk_free |
±------±----------------±----------±-------------±---------±---------
| zone3 | 10.0.2.110:2882 | 32 | 26 | 6 | 200.50 | 16.04 | 117.00 | 67.46 | 359.81 | 347.04 | 12.77 | 1147.38 | 49.93 | 1097.45 |
| zone1 | 10.0.2.108:2882 | 32 | 26 | 6 | 201.29 | 16.10 | 117.00 | 68.18 | 359.81 | 347.04 | 12.77 | 1147.38 | 50.08 | 1097.30 |
| zone2 | 10.0.2.109:2882 | 32 | 26 | 6 | 201.29 | 16.10 | 117.00 | 68.18 | 359.81 | 347.04 | 12.77 | 1147.38 | 51.37 | 1096.02 |
±------±----------------±----------±-------------±---------±---------
3 rows in set (0.28 sec)
select a.zone,a.svr_ip,b.tenant_name,b.tenant_type, a.max_cpu, a.min_cpu,
→ round(a.memory_size/1024/1024/1024,2) memory_size_gb,
→ round(a.log_disk_size/1024/1024/1024,2) log_disk_size,
→ round(a.log_disk_in_use/1024/1024/1024,2) log_disk_in_use,
→ round(a.data_disk_in_use/1024/1024/1024,2) data_disk_in_use
→ from oceanbase.gv$ob_units a join oceanbase.dba_ob_tenants b on a.tenant_id=b.tenant_id order by b.tenant_name;
±------±-----------±------------±------------±--------+
| zone | svr_ip | tenant_name | tenant_type | max_cpu | min_cpu | memory_size_gb | log_disk_size | log_disk_in_use | data_disk_in_use |
±------±-----------±------------±------------±--------+
| zone2 | 10.0.2.109 | ccs | USER | 2 | 2 | 7.00 | 21.60 | 10.93 | 0.13 |
| zone1 | 10.0.2.108 | ccs | USER | 2 | 2 | 7.00 | 21.60 | 10.93 | 0.13 |
| zone3 | 10.0.2.110 | ccs | USER | 2 | 2 | 7.00 | 21.60 | 10.93 | 0.13 |
| zone2 | 10.0.2.109 | ccs2 | USER | 2 | 2 | 7.00 | 21.60 | 17.27 | 0.17 |
| zone1 | 10.0.2.108 | ccs2 | USER | 2 | 2 | 7.00 | 21.60 | 17.27 | 0.17 |
| zone3 | 10.0.2.110 | ccs2 | USER | 2 | 2 | 7.00 | 21.60 | 17.27 | 0.17 |
| zone2 | 10.0.2.109 | ccs3 | USER | 2 | 2 | 7.00 | 21.60 | 17.26 | 0.40 |
| zone1 | 10.0.2.108 | ccs3 | USER | 2 | 2 | 7.00 | 21.60 | 17.26 | 0.40 |
| zone3 | 10.0.2.110 | ccs3 | USER | 2 | 2 | 7.00 | 21.60 | 17.26 | 0.40 |
| zone3 | 10.0.2.110 | META$1002 | META | NULL | NULL | 4.80 | 14.40 | 11.48 | 0.50 |
| zone2 | 10.0.2.109 | META$1002 | META | NULL | NULL | 4.80 | 14.40 | 11.48 | 0.52 |
| zone1 | 10.0.2.108 | META$1002 | META | NULL | NULL | 4.80 | 14.40 | 11.48 | 0.52 |
| zone2 | 10.0.2.109 | META$1004 | META | NULL | NULL | 3.20 | 9.60 | 7.67 | 0.61 |
| zone1 | 10.0.2.108 | META$1004 | META | NULL | NULL | 3.20 | 9.60 | 7.67 | 0.58 |
| zone3 | 10.0.2.110 | META$1004 | META | NULL | NULL | 3.20 | 9.60 | 7.67 | 0.62 |
| zone2 | 10.0.2.109 | META$1006 | META | NULL | NULL | 1.00 | 2.40 | 1.92 | 0.42 |
| zone1 | 10.0.2.108 | META$1006 | META | NULL | NULL | 1.00 | 2.40 | 1.92 | 0.42 |
| zone3 | 10.0.2.110 | META$1006 | META | NULL | NULL | 1.00 | 2.40 | 1.92 | 0.42 |
| zone2 | 10.0.2.109 | META$1008 | META | NULL | NULL | 1.00 | 2.40 | 1.86 | 0.32 |
| zone1 | 10.0.2.108 | META$1008 | META | NULL | NULL | 1.00 | 2.40 | 1.86 | 0.32 |
| zone3 | 10.0.2.110 | META$1008 | META | NULL | NULL | 1.00 | 2.40 | 1.86 | 0.32 |
| zone3 | 10.0.2.110 | META$1010 | META | NULL | NULL | 1.00 | 2.40 | 1.86 | 0.36 |
| zone2 | 10.0.2.109 | META$1010 | META | NULL | NULL | 1.00 | 2.40 | 1.86 | 0.37 |
| zone1 | 10.0.2.108 | META$1010 | META | NULL | NULL | 1.00 | 2.40 | 1.86 | 0.35 |
| zone3 | 10.0.2.110 | META$1012 | META | NULL | NULL | 1.00 | 2.40 | 1.86 | 0.37 |
| zone1 | 10.0.2.108 | META$1012 | META | NULL | NULL | 1.00 | 2.40 | 1.86 | 0.37 |
| zone2 | 10.0.2.109 | META$1012 | META | NULL | NULL | 1.00 | 2.40 | 1.86 | 0.38 |
| zone1 | 10.0.2.108 | sit13 | USER | 6 | 6 | 28.80 | 86.40 | 69.06 | 4.75 |
| zone3 | 10.0.2.110 | sit13 | USER | 6 | 6 | 28.80 | 86.40 | 69.06 | 4.76 |
| zone2 | 10.0.2.109 | sit13 | USER | 6 | 6 | 28.80 | 86.40 | 69.06 | 4.76 |
| zone3 | 10.0.2.110 | sys | SYS | 4 | 4 | 5.00 | 11.04 | 8.77 | 0.58 |
| zone2 | 10.0.2.109 | sys | SYS | 4 | 4 | 5.00 | 11.04 | 8.77 | 0.58 |
| zone1 | 10.0.2.108 | sys | SYS | 4 | 4 | 5.00 | 11.04 | 8.77 | 0.57 |
| zone2 | 10.0.2.109 | uat14 | USER | 6 | 6 | 43.20 | 129.60 | 103.67 | 36.82 |
| zone3 | 10.0.2.110 | uat14 | USER | 6 | 6 | 43.20 | 129.60 | 103.67 | 36.81 |
| zone1 | 10.0.2.108 | uat14 | USER | 6 | 6 | 43.20 | 129.60 | 103.67 | 36.81 |
| zone2 | 10.0.2.109 | uat14dqs | USER | 4 | 4 | 7.00 | 21.60 | 17.26 | 1.76 |
| zone3 | 10.0.2.110 | uat14dqs | USER | 4 | 4 | 7.00 | 21.60 | 17.26 | 1.76 |
| zone1 | 10.0.2.108 | uat14dqs | USER | 4 | 4 | 7.00 | 21.60 | 17.26 | 1.76 |
±------±-----------±------------±------------±--------±—
不好意思,你可能是误解了我发的问题的截图,问题里我发了2个top sql的截图,第一张是有问题的环境测试环境,版本是4.2.5.5,第二张topsql截图是生产环境的4.2.1.3,没问题的,主要为了做对比使用,他俩一个sql量特别多,一个sql量特别少,为了避免误解,我重新上传一下有问题的测试环境的topsql截图和execl ,辛苦老师
学习了
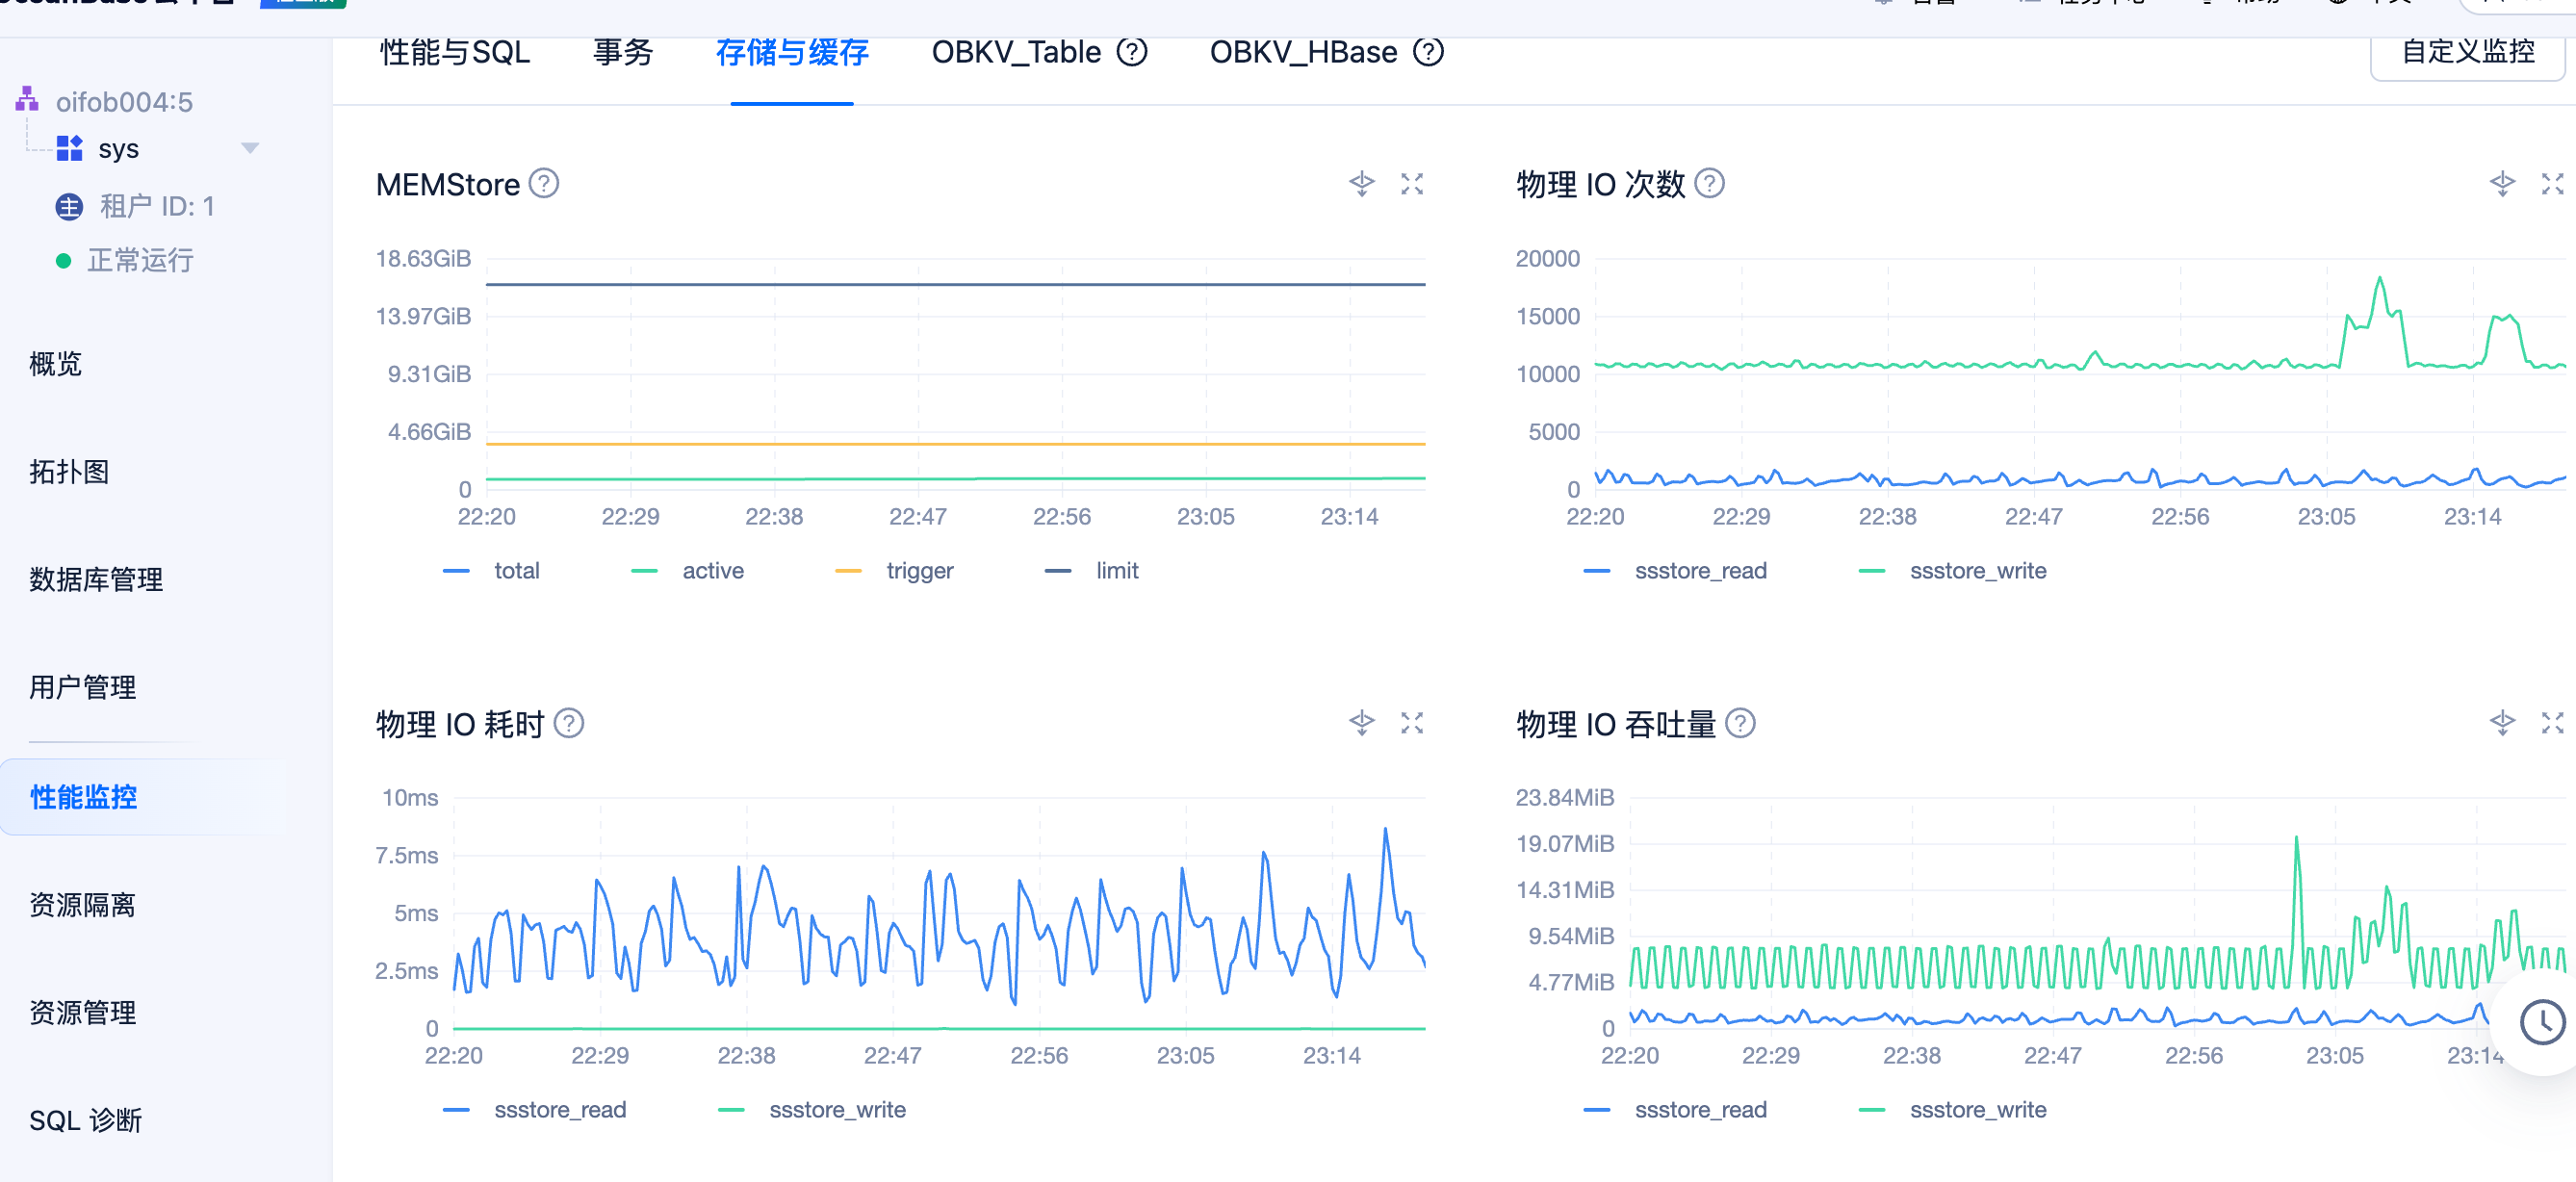
你使用的是固态盘还是机械盘 如果是固态盘看着物理的io耗时挺长的
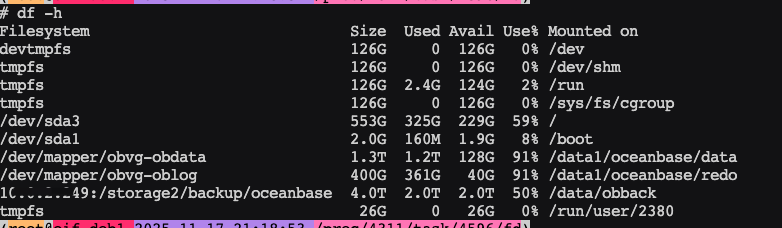
2 x 960GB SATA SSD读取密集型6G 2.5吋
是使用的ssd盘2块做的raid0,然后通过卷的方式分配给/dev/mapper/obvg-obdata和/dev/mapper/obvg-oblog使用
操作系统使用的是:
"2 x 600GB SAS 15K6G raid1
同时3台机器的io都高,前一段时间是没有这个问题的,好像是最近一段时间才出现的
学习了,固态和机械盘的差距还是很大的
都是ssd的盘,性能都是很好的呀,很奇怪,为啥还是一直那么高
老师,目前还有其他的分析思路吗?
不是的,我发的sql是发帖时间前半小时的,而且任意30分钟的sys租户sql量都差不多,我重新发下半小时的完整数据,供分析,多谢老师
没有看到IO消耗明显异常的SQL,只有sys租户的write IOPS 在10K c/s 吗?其它租户的IOPS情况也是这样吗?
你们这个上面 有部署的zabbix么?或者其他的系统的监控或者装一个tsar命令
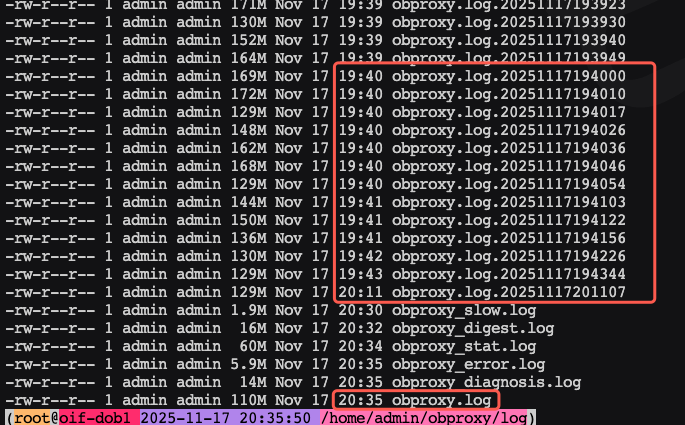
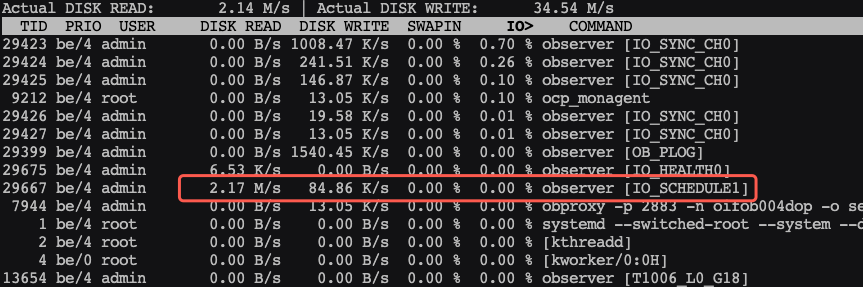
2.通过上面第一步操作,磁盘的io的写入量明显减少,但是发现磁盘io依然100%,sys租户的iops还是一直没有降低,通过上面的步骤进一步排查,发现observer [IO_SCHEDULE1]进程的io读写也很高,同时查看observer.log的文件增量也很快,辛苦帮忙分析一下,附件为observer.log的内容
observer.log.tar.gz (7.5 MB)
注:observer.log和obproxy.log是在写在sda盘的,磁盘io使用率目前运行正常,io特别高的是sdc盘和sdb盘,这两个盘通过卷的方式存放的是数据目录和clog目录