本文是庆涛 @obpilot 参加 “OBD 单机部署上手体验征文” 活动的一篇文章,在这里分享给大家~
1. 概述
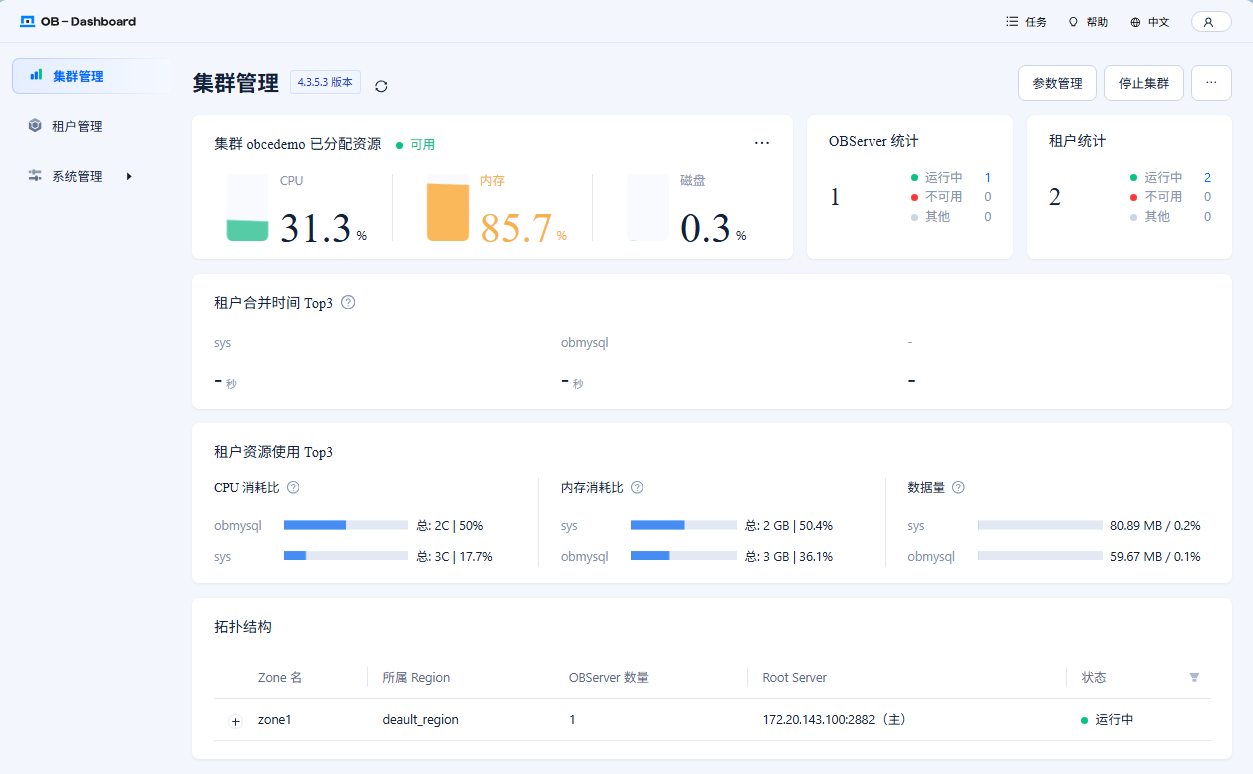
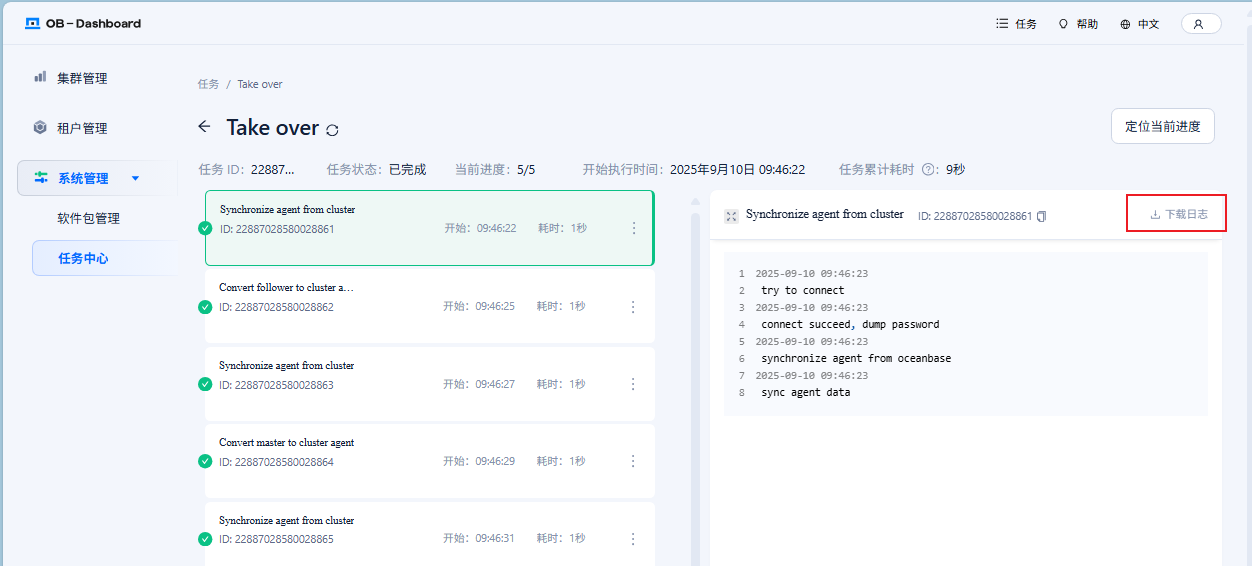
本文主要分享在Windows 笔记本上的 Linux 子系统 Ubuntu 上部署 OB 社区版单机版的过程以及相关原理讲解。 本次部署没有部署 OCP ,OB 集群的部署是依赖 obd web 平台做的。部署后会自动启动 OB-Dashboard (进程是 obshell ,Http 端口是 2886 )。通过 OB-Dashbaord 也可以做一些简单的 OB 单节点运维。
2. 环境准备
部署环境是 Windows 笔记本上的一个 WSL 子系统,选择的是 Ubuntu-22.04 。大概 16C 22G 内存资源,1T 空间。
d:\Download>wsl -l -v
  NAME                 STATE           VERSION
* Ubuntu-22.04         Running         2
2.1 资源检查
OB 社区版运行最小资源规格官网说明是 2C4G 。考虑到 OB 的多租户能力,这里就不测试这种小规格了,个人在生产部署最低要求 8C16G 。
进入 Ubuntu 系统后,核实一下机器资源。
- 检查 CPU 数量和指令集选项
mq@OBPILOT:~$ lscpu
Architecture:             x86_64
  CPU op-mode(s):         32-bit, 64-bit
  Address sizes:          48 bits physical, 48 bits virtual
  Byte Order:             Little Endian
CPU(s):                   16
  On-line CPU(s) list:    0-15
Vendor ID:                AuthenticAMD
  Model name:             AMD Ryzen 7 7840U w/ Radeon 780M Graphics
    CPU family:           25
    Model:                116
    Thread(s) per core:   2
    Core(s) per socket:   8
    Socket(s):            1
    Stepping:             1
    BogoMIPS:             6587.24
    Flags:                fpu vme de pse tsc msr pae mce cx8 apic sep mtrr pge mca cmov pat pse36 clflush mmx fxsr sse sse2 ht syscall nx mmxext fxsr_opt pdpe1gb rdtscp
                          lm constant_tsc rep_good nopl tsc_reliable nonstop_tsc cpuid extd_apicid pni pclmulqdq ssse3 fma cx16 sse4_1 sse4_2 movbe popcnt aes xsave avx
                          f16c rdrand hypervisor lahf_lm cmp_legacy svm cr8_legacy abm sse4a misalignsse 3dnowprefetch osvw topoext perfctr_core ssbd ibrs ibpb stibp vmm
                          call fsgsbase bmi1 avx2 smep bmi2 erms invpcid avx512f avx512dq rdseed adx smap avx512ifma clflushopt clwb avx512cd sha_ni avx512bw avx512vl xs
                          aveopt xsavec xgetbv1 xsaves avx512_bf16 clzero xsaveerptr arat npt nrip_save tsc_scale vmcb_clean flushbyasid decodeassists pausefilter pfthre
                          shold v_vmsave_vmload avx512vbmi umip avx512_vbmi2 gfni vaes vpclmulqdq avx512_vnni avx512_bitalg avx512_vpopcntdq rdpid fsrm
Virtualization features:
  Virtualization:         AMD-V
  Hypervisor vendor:      Microsoft
  Virtualization type:    full
Caches (sum of all):
  L1d:                    256 KiB (8 instances)
  L1i:                    256 KiB (8 instances)
  L2:                     8 MiB (8 instances)
  L3:                     16 MiB (1 instance)
Vulnerabilities:
  Gather data sampling:   Not affected
  Itlb multihit:          Not affected
  L1tf:                   Not affected
  Mds:                    Not affected
  Meltdown:               Not affected
  Mmio stale data:        Not affected
  Reg file data sampling: Not affected
  Retbleed:               Not affected
  Spec rstack overflow:   Mitigation; safe RET
  Spec store bypass:      Mitigation; Speculative Store Bypass disabled via prctl and seccomp
  Spectre v1:             Mitigation; usercopy/swapgs barriers and __user pointer sanitization
  Spectre v2:             Mitigation; Retpolines; IBPB conditional; IBRS_FW; STIBP always-on; RSB filling; PBRSB-eIBRS Not affected; BHI Not affected
  Srbds:                  Not affected
  Tsx async abort:        Not affected
CPU 是 AMD 的,其中关键信息是 16 个 逻辑 CPU,CPU Flags 支持 avx2、avx512 相关指令集。
- 检查内存大小,特别是可用内存
mq@OBPILOT:~$ free -h
               total        used        free      shared  buff/cache   available
Mem:            23Gi       548Mi        22Gi        14Mi       236Mi        22Gi
Swap:          4.0Gi          0B       4.0Gi
- 检查 github 地址
OB 社区版在 github 开源,开源地址在这里,欢迎大家关注和点 star ~
mq@OBPILOT:~/obce/ob-deploy$ ping github.com
PING github.com (20.205.243.166) 56(84) bytes of data.
64 bytes from 20.205.243.166: icmp_seq=3 ttl=110 time=85.0 ms
64 bytes from 20.205.243.166 (20.205.243.166): icmp_seq=4 ttl=110 time=84.5 ms
64 bytes from 20.205.243.166: icmp_seq=5 ttl=110 time=84.0 ms
64 bytes from 20.205.243.166 (20.205.243.166): icmp_seq=6 ttl=110 time=86.2 ms
64 bytes from 20.205.243.166: icmp_seq=7 ttl=110 time=87.1 ms
64 bytes from 20.205.243.166 (20.205.243.166): icmp_seq=8 ttl=110 time=89.3 ms
^C64 bytes from 20.205.243.166: icmp_seq=9 ttl=110 time=88.5 ms

--- github.com ping statistics ---
9 packets transmitted, 7 received, 22.2222% packet loss, time 35399ms
rtt min/avg/max/mdev = 84.003/86.359/89.261/1.865 ms
mq@OBPILOT:~/obce/ob-deploy$
- 检查 gcc 编译命令
mq@OBPILOT:~/obce/ob-deploy$ gcc --version
gcc (Ubuntu 11.4.0-1ubuntu1~22.04.2) 11.4.0
Copyright (C) 2021 Free Software Foundation, Inc.
This is free software; see the source for copying conditions.  There is NO
warranty; not even for MERCHANTABILITY or FITNESS FOR A PARTICULAR PURPOSE.
- 检查防火墙状态
mq@OBPILOT:~/obce/ob-deploy$ sudo ufw status
Status: inactive
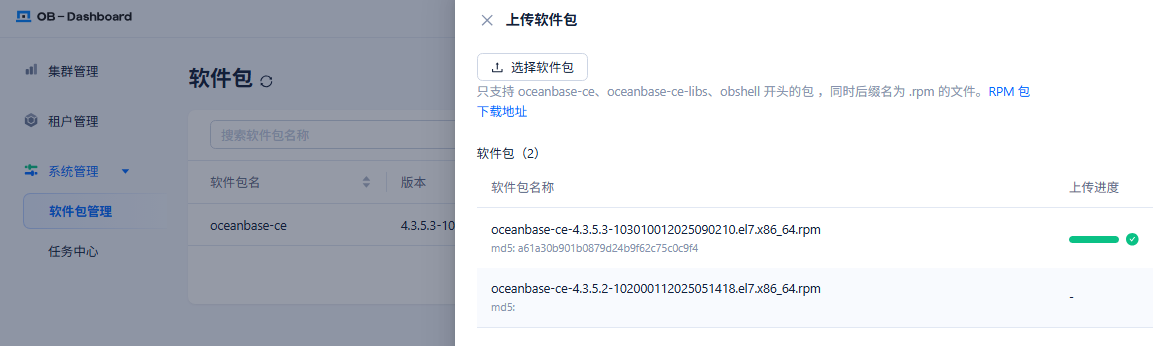
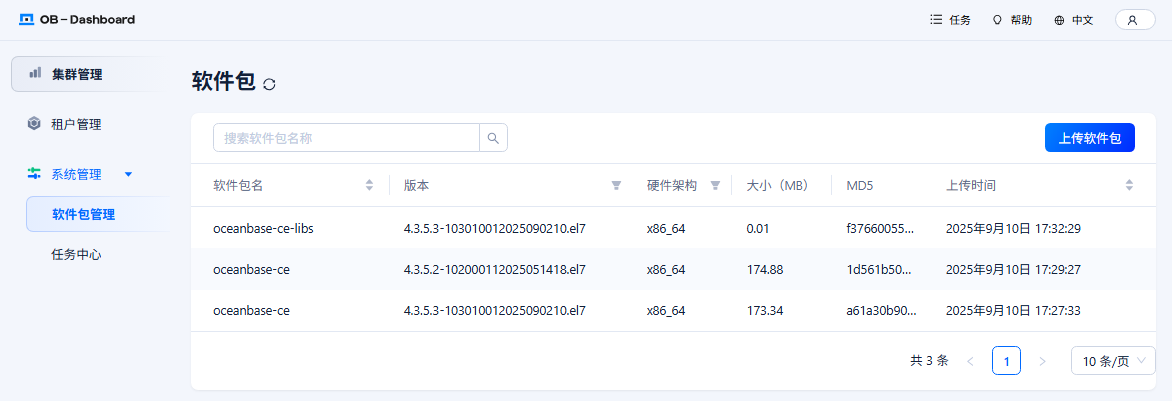
2.2 下载软件
部署下载地址: https://www.oceanbase.com/softwarecenter
OB 软件后期通过部署软件自动下载。
CentOS/RHEL/Fedora 等使用 RPM 包管理系统(.rpm文件),Ubuntu/Debian 等使用 Debian 包管理系统(.deb文件)。这两种格式互不兼容,Ubuntu 的 dpkg和 apt无法直接安装或管理 RPM 文件。
官网 OBD 的软件包只有 RPM 格式,分别支持 x86 版和 ARM 版。 所以这里有多个途径可以在 Ubuntu 下使用 RPM 包。
-
- 安装 rpm 命令
-
- 将 rpm 文件转换为 deb 文件
-
- 提取 RPM 包内容手动安装。
这里首先演示一下 3 ,这样能理解 rpm 包的原理。
首先安装提取 RPM 包所需要的软件。
sudo apt update
sudo apt install rpm2cpio cpio
然后创建目录 ob-deploy 并提取文件到目录中。
mkdir ob-deploy
cd ob-deploy
rpm2cpio ../ob-deploy-3.6.0-3.el7.x86_64.rpm | cpio -idmv
查看解压缩的目录结构,也能看出原 RPM 包安装的时候文件会复制到的目标目录。
mq@OBPILOT:~/obce/ob-deploy$ tree -L 3
.
├── etc
│   └── profile.d
│       └── obd.sh
└── usr
    ├── bin
    │   └── obd
    └── obd
        ├── config_parser
        ├── example
        ├── lib
        ├── mirror
        ├── optimize
        ├── plugins
        ├── web
        └── workflows

13 directories, 2 files
所以,手动将这些目录文件复制到系统目录。
sudo cp -r etc/* /etc/
sudo cp -r usr/* /usr/
which obd

obd --version

mq@OBPILOT:~/obce/ob-deploy$ which obd
/usr/bin/obd
mq@OBPILOT:~/obce/ob-deploy$ obd --version
OceanBase Deploy: 3.6.0
REVISION: b36013bb09a84516e56db51dba78a9d9096735e7
BUILD_BRANCH: HEAD
BUILD_TIME: Sep 04 2025 10:50:58OURCE
Copyright (C) 2025 OceanBase
License Apache 2.0: Apache version 2 or later <https://www.apache.org/licenses/LICENSE-2.0>.
This is free software: you are free to change and redistribute it.
There is NO WARRANTY, to the extent permitted by law.
3. 安装部署
3.1 前置部署
- 关闭防火墙(如果之前开了)
mq@OBPILOT:~/obce/ob-deploy$ sudo ufw disable
Firewall stopped and disabled on system startup
- 安装依赖包
sudo apt update
sudo apt install -y gcc make libssl-dev python3 python3-pip libaio1 libaio-dev
- 修改内核参数
# 创建自定义配置文件
sudo tee /etc/sysctl.d/99-custom.conf << EOF
vm.swappiness=0
net.core.somaxconn=2048
vm.overcommit_memory=0
fs.file-max=6573688
EOF

# 应用所有配置
sudo sysctl --system
- 创建用户
admin
sudo useradd -m -s /bin/bash -g admin admin
sudo passwd admin
Ubuntu 里默认没有 admin 用户,但是可能有个 admin 用户组,并且默认有 sudo 权限。这个也符合 OB 运维需求,admin 用户有 sudo 权限,能减少切换 root 的次数,降低误操作风险。这里各个客户公司安全规范不一,可以不一样。
mq@OBPILOT:~$ sudo su - admin
To run a command as administrator (user "root"), use "sudo <command>".
See "man sudo_root" for details.

Welcome to Ubuntu 22.04.5 LTS (GNU/Linux 5.15.167.4-microsoft-standard-WSL2 x86_64)

 * Documentation:  https://help.ubuntu.com
 * Management:     https://landscape.canonical.com
 * Support:        https://ubuntu.com/pro

 System information as of Mon Sep  8 17:09:42 CST 2025

  System load:  0.19                Processes:             55
  Usage of /:   4.5% of 1006.85GB   Users logged in:       1
  Memory usage: 3%                  IPv4 address for eth0: 172.20.143.100
  Swap usage:   0%

 * Strictly confined Kubernetes makes edge and IoT secure. Learn how MicroK8s
   just raised the bar for easy, resilient and secure K8s cluster deployment.

   https://ubuntu.com/engage/secure-kubernetes-at-the-edge

This message is shown once a day. To disable it please create the
/home/admin/.hushlogin file.
admin@OBPILOT:~$ sudo date

[sudo] password for admin:
Mon Sep  8 17:09:59 CST 2025
- 安装 SSH 服务
WSL 子系统 Ubuntu 默认没有启动 SSHD 服务,还需要安装一下。
sudo apt update
sudo apt install openssh-server
启动服务 SSH 。
# 手动启动
sudo service ssh start

# 检查状态
sudo service ssh status

# 停止服务
sudo service ssh stop

mq@OBPILOT:~$ sudo service ssh status
● ssh.service - OpenBSD Secure Shell server
     Loaded: loaded (/lib/systemd/system/ssh.service; enabled; vendor preset: enabled)
     Active: active (running) since Mon 2025-09-08 17:14:11 CST; 2min 52s ago
       Docs: man:sshd(8)
             man:sshd_config(5)
   Main PID: 4696 (sshd)
      Tasks: 1 (limit: 28835)
     Memory: 1.7M
     CGroup: /system.slice/ssh.service
             └─4696 "sshd: /usr/sbin/sshd -D [listener] 0 of 10-100 startups"

Sep 08 17:14:11 OBPILOT systemd[1]: Starting OpenBSD Secure Shell server...
Sep 08 17:14:11 OBPILOT sshd[4696]: Server listening on 0.0.0.0 port 22.
Sep 08 17:14:11 OBPILOT sshd[4696]: Server listening on :: port 22.
Sep 08 17:14:11 OBPILOT systemd[1]: Started OpenBSD Secure Shell server.
- 准备数据目录
通常 OB 有两个主要目录。数据目录放在 /data/1 ,(事务)日志目录放在 /data/log1 。生产环境这两个目录要用独立的磁盘和文件系统。这里是测试环境,就共用一块盘和文件系统了。
sudo mkdir -p /data && sudo chown -R admin.admin /data
3.2 OBD 白屏部署 OB 单机版
这里就部署在当前用户(普通用户mq下),个人认为部署在 root 下是很危险的。
mq@OBPILOT:~$ sudo obd web start
start OBD WEB in 0.0.0.0:8680
please open http://127.0.1.1:8680
这里注意我是用 sudo 命令启动的。 用跟不用区别很大,不用,就是安装到当前用户下;用,就是可以安装到不同用户下(我也不想安装到 root 用户下)。
这里提示的访问地址是 127.0.0.1 ,由于是虚拟机,外面肯定无法访问这个地址。所以还需要查看虚拟机地址。
mq@OBPILOT:~$ ip addr
1: lo: <LOOPBACK,UP,LOWER_UP> mtu 65536 qdisc noqueue state UNKNOWN group default qlen 1000
    link/loopback 00:00:00:00:00:00 brd 00:00:00:00:00:00
    inet 127.0.0.1/8 scope host lo
       valid_lft forever preferred_lft forever
    inet 10.255.255.254/32 brd 10.255.255.254 scope global lo
       valid_lft forever preferred_lft forever
    inet6 ::1/128 scope host
       valid_lft forever preferred_lft forever
2: eth0: <BROADCAST,MULTICAST,UP,LOWER_UP> mtu 1500 qdisc mq state UP group default qlen 1000
    link/ether 00:15:5d:73:e0:00 brd ff:ff:ff:ff:ff:ff
    inet 172.20.143.100/20 brd 172.20.143.255 scope global eth0
       valid_lft forever preferred_lft forever
    inet6 fe80::215:5dff:fe73:e000/64 scope link
       valid_lft forever preferred_lft forever
里面真实 IP 是 172.20.143.100 ,所以访问地址是: http://172.20.143.100:8680/

看到这个页面,就成功了四分之一。点击“开启体验之旅”。
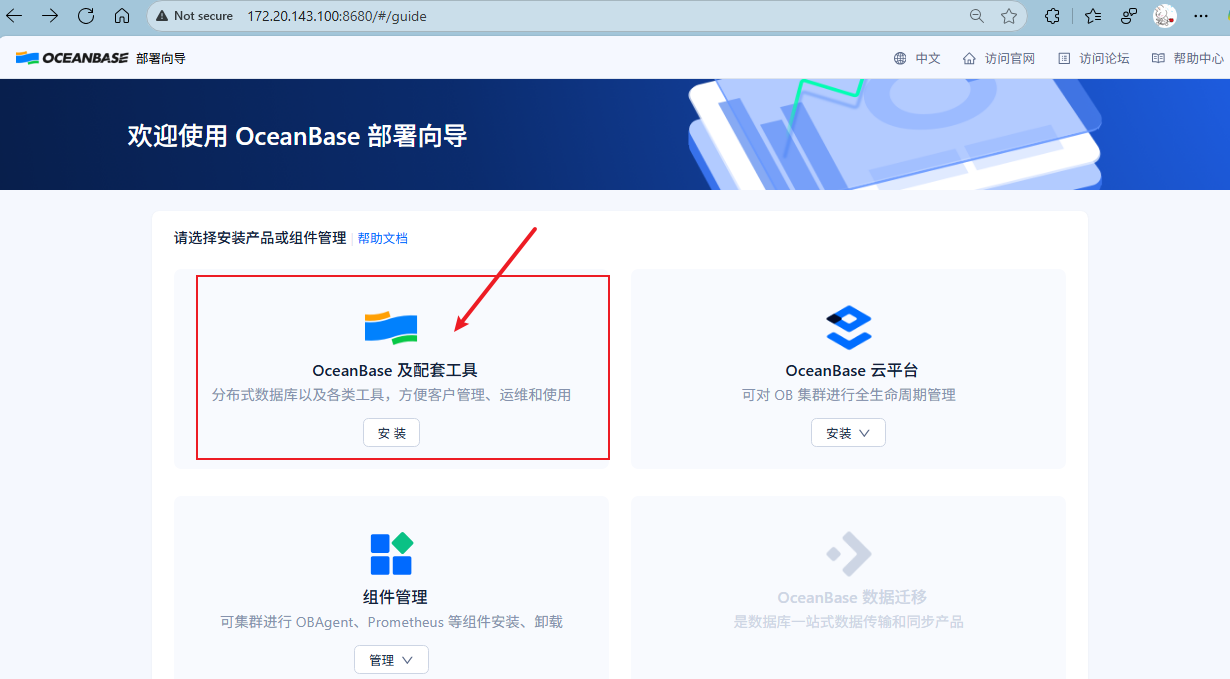
这里 OBD WEB 提供了 OB 的部署、OB 云平台的部署以及组件的管理。本文主要探索 OB 单机部署,所以不选择 【OB 云平台】,选第一个【OB 及配套工具】。
后面会进入 OB 部署向导页面。
3.2.1 部署配置
- 设置集群名称 和选择 数据库版本

集群名称很重要,后期不能改。
版本的选择,如果是正式业务用,就查看官网 Release Note 里。一般首先用 LTS 版本(4.2.5 或 4.3.5 ),然后选择倒数第二个 BP 版本。
- 选择负载类型

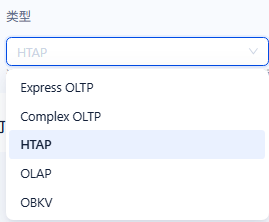
负载类型有 OLTP、OLAP、HTAP、OBKV 等。选错了也没关系。这个选择只是影响一些参数的设置,并且这些参数后期都可以改。
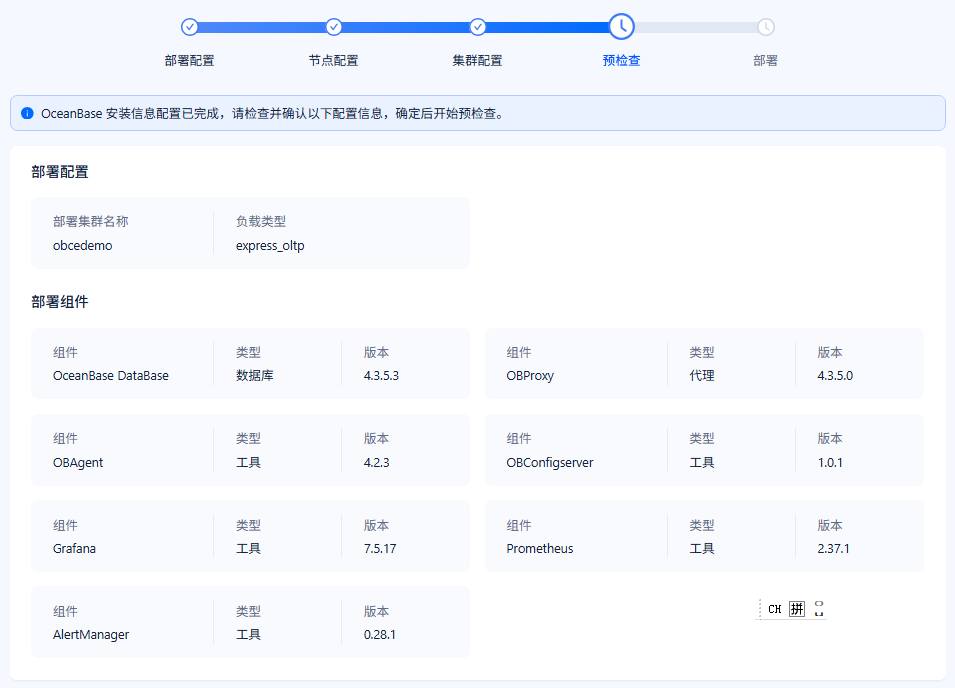
- 选择组件
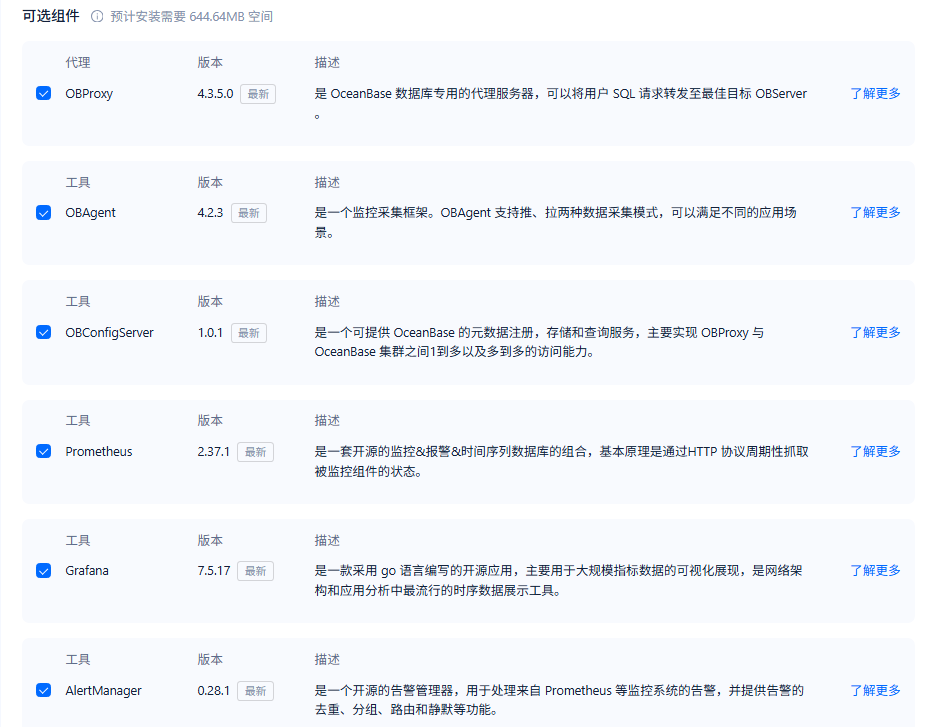
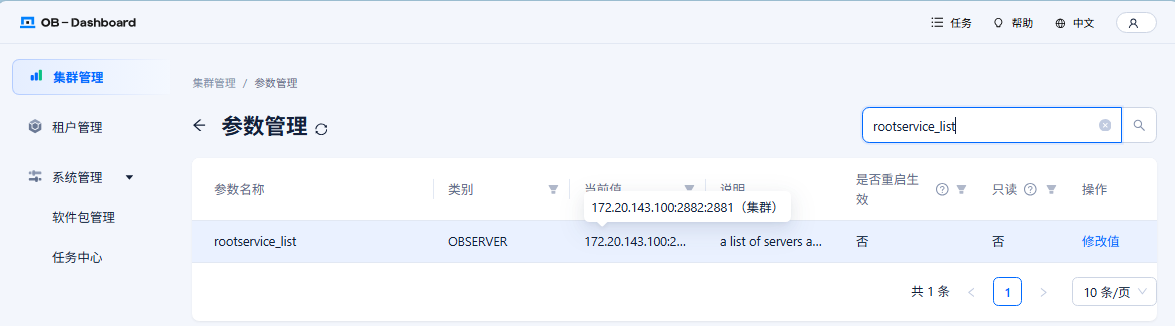
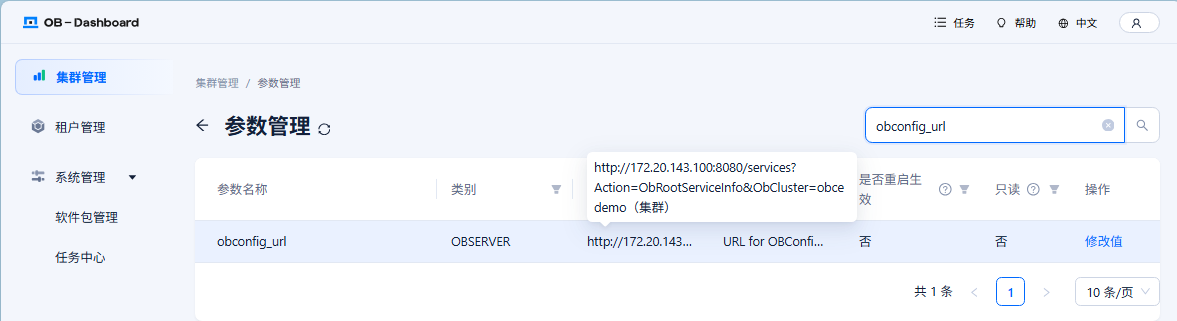
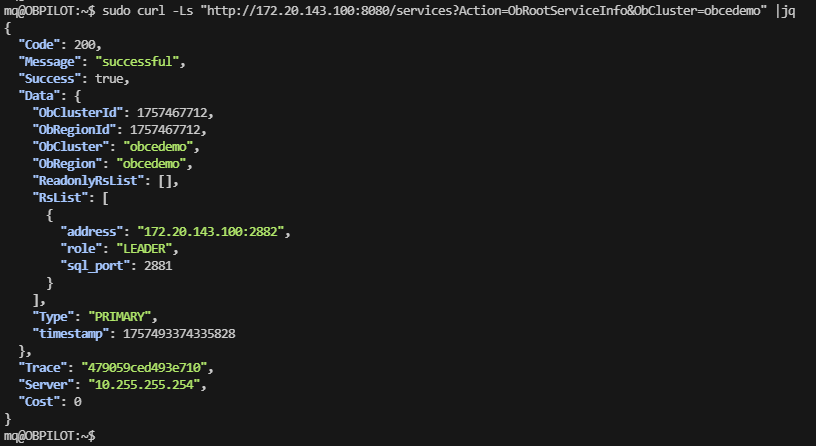
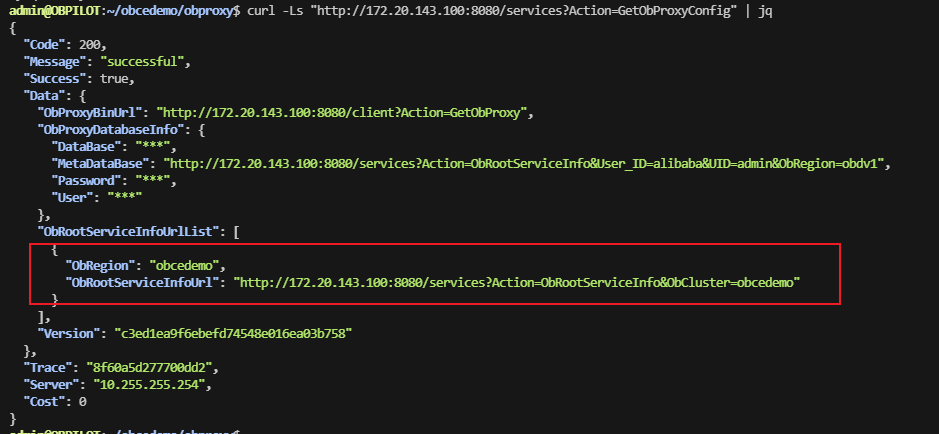
这些组件的作用在生产的运维,都很有必要。 有 OCP 的场景里,这些组件都在后台默默的工作(除了 OBConfigServer);没有 OCP 的场景里,组件的作用就浮出水面了。
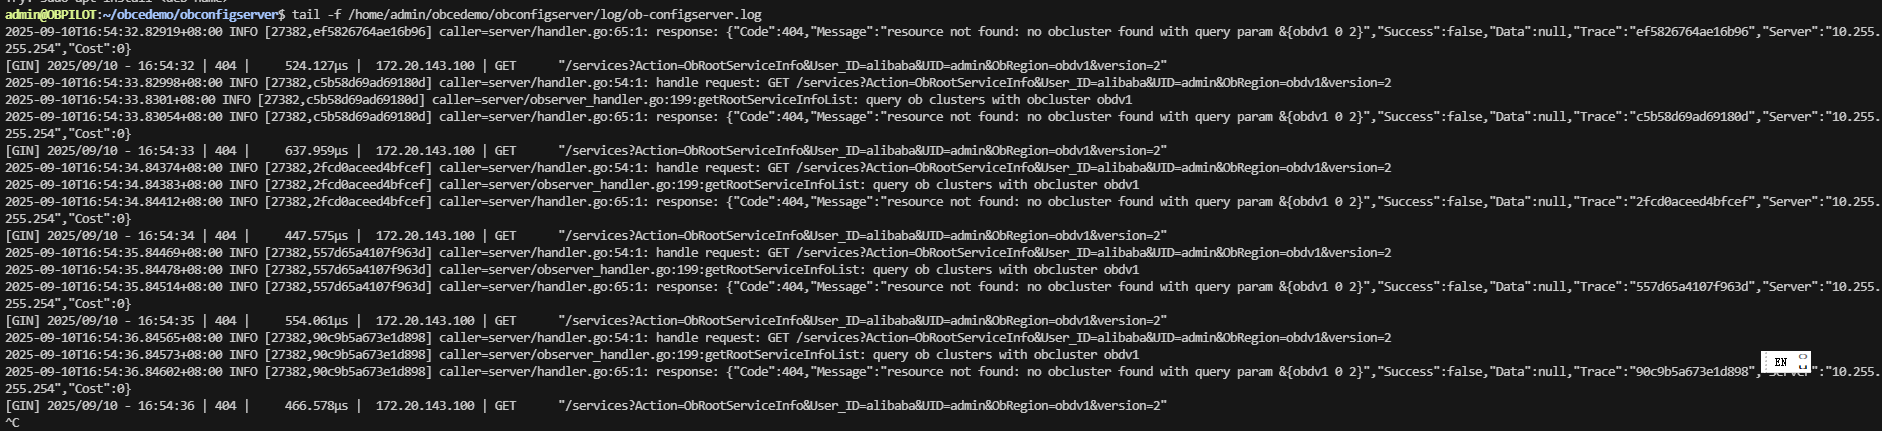
所有组件除了 OBConfigServer 外大家都能理解,OBConfigServer 应该是一个“服务”,用于OB RS 的元信息的注册、查询和存储。以前手动部署 OB 集群的时候,缺陷就是 RS 是写死 IP 的,有了这个服务,OBProxy 就可以写死这个服务的 API 地址动态获取 OB 集群的 RS 地址。
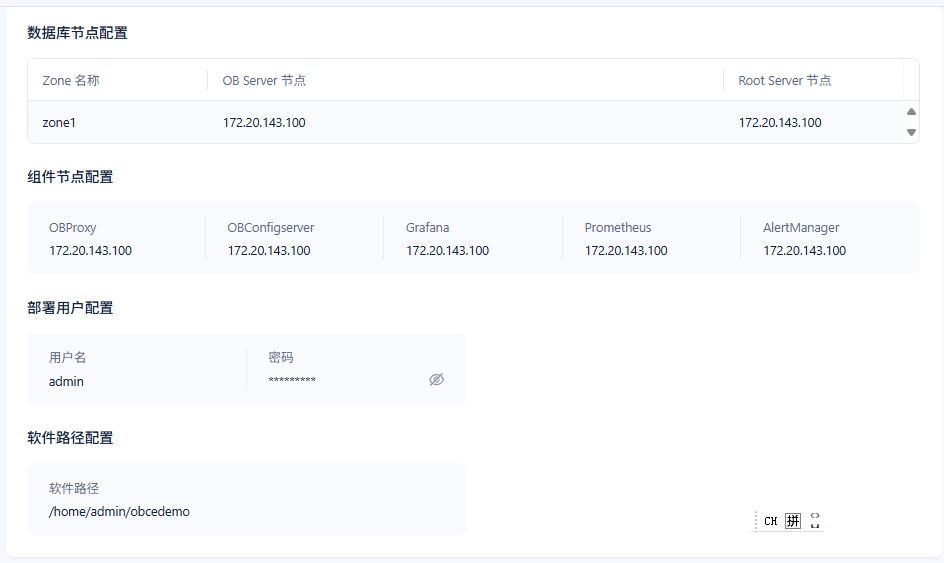
3.2.2 节点配置
- 指定数据库节点和组件节点
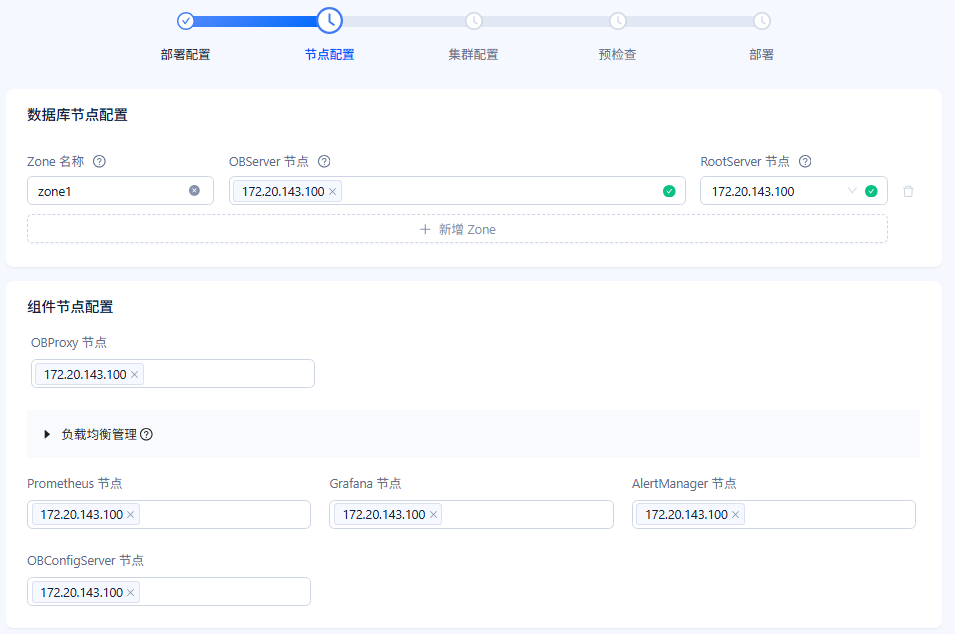
这里只有一个节点,并且尽量不要用 127.0.0.1 那个地址,改用实际的 IP 。
- 指定部署用户

部署用户名就用常用的 admin 用户。不要用 root!
- 指定软件路径配置

部署目录就用常用的默认目录:/home/admin/obcedemo 。
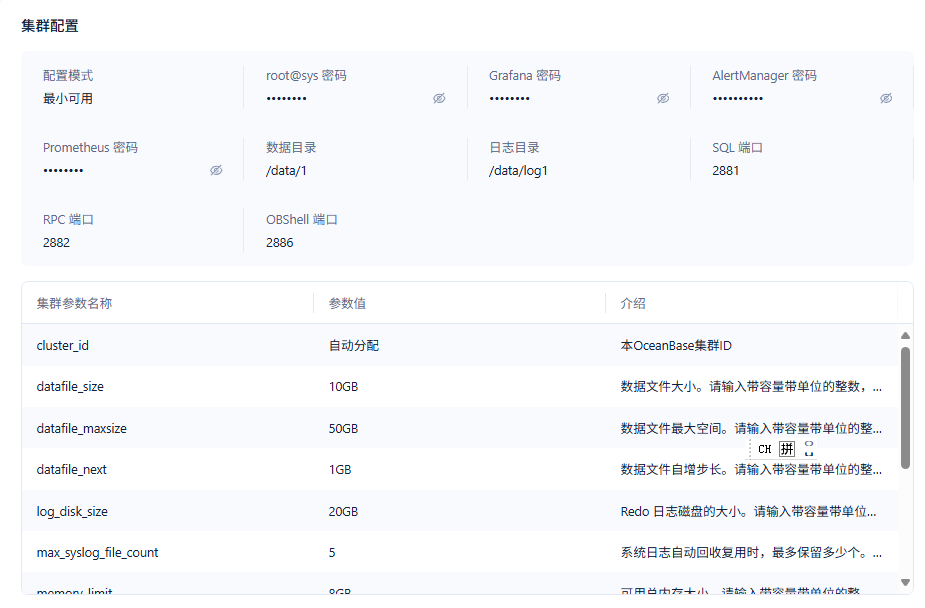
3.2.3 集群配置
- 设置集群密码、数据目录、端口

模式配置如果是生产服务器,就选择“最大占用”;开发测试环境选择“最小可用”。这个是给不熟悉 OB 的人使用。选错不要紧,后面还可以改相应参数。
OBShell 端口 2886 后面会有用。
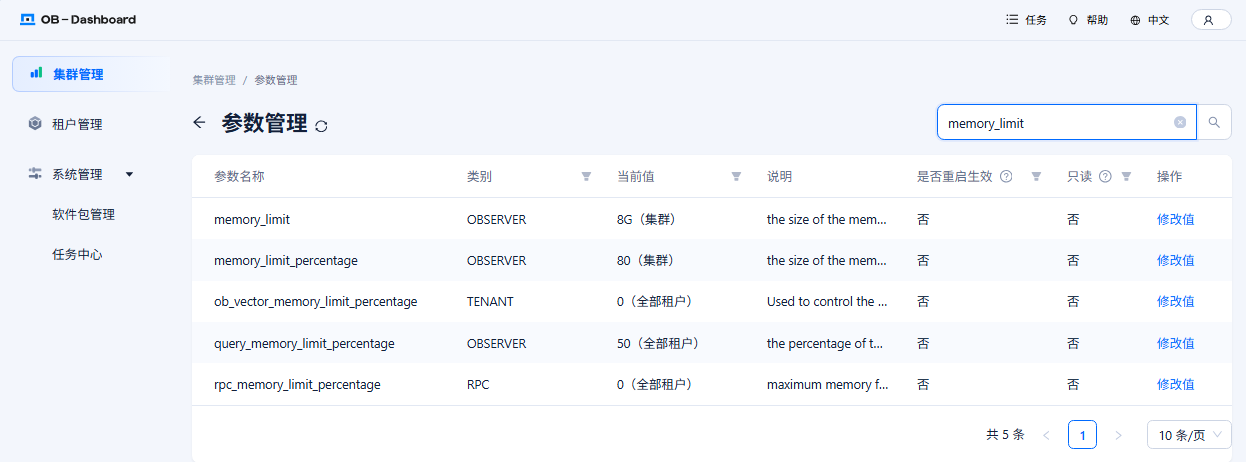
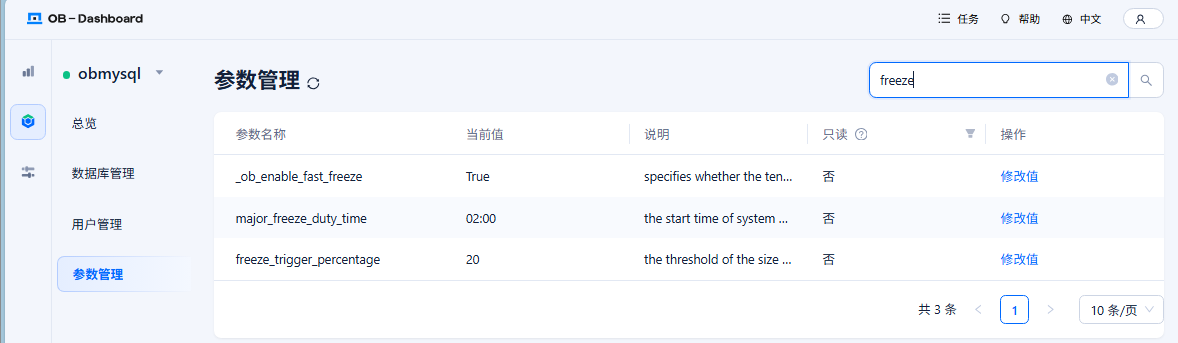
- 配置更多参数
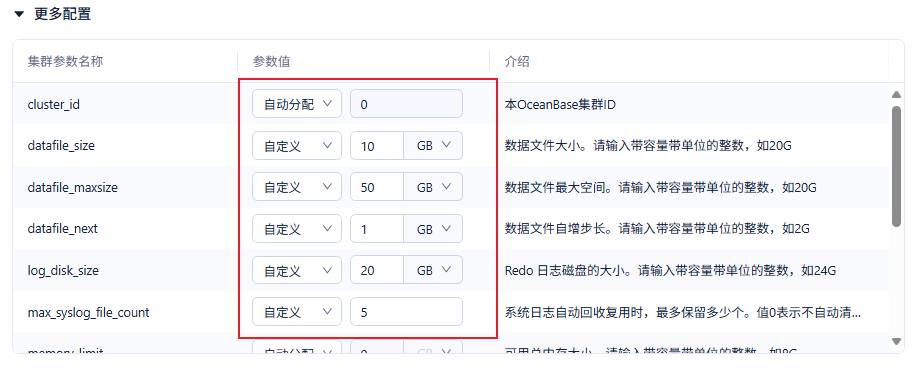
即使是初学者,也建议配置这些参数。否则后面磁盘和内存被用去大半会让人很意外。这里的每个参数都有其用处,可以参考图中配置。
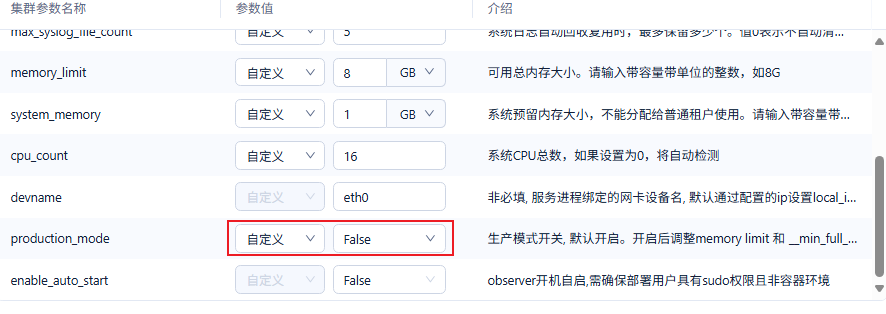
小内存规格下,参数product_mode 设置为 False 。
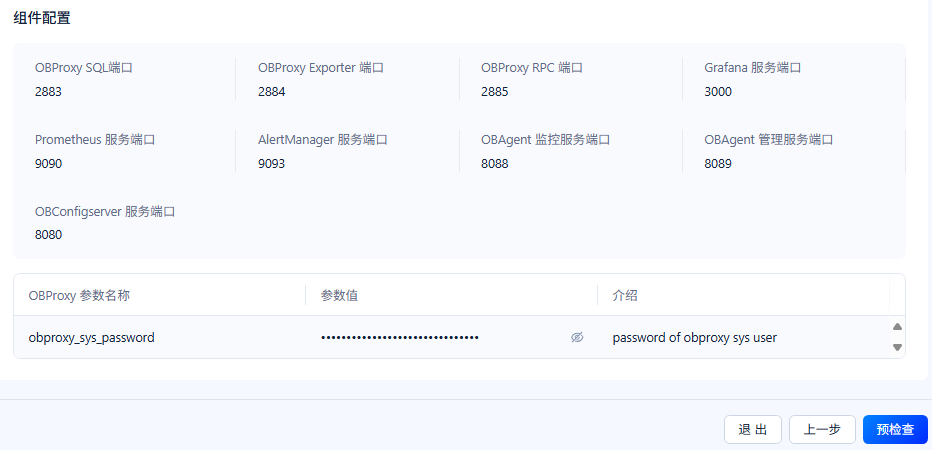
- 配置组件参数
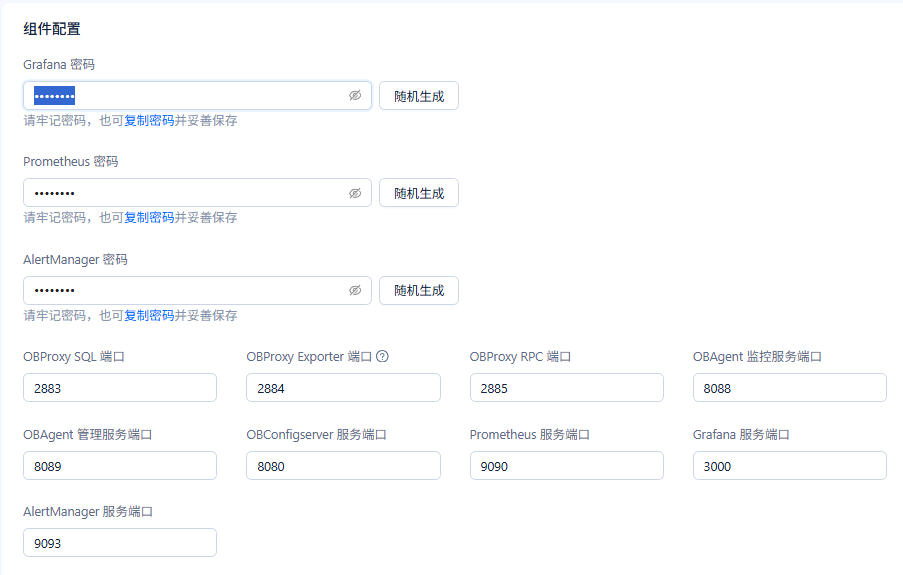
主要就设置一下密码,其他参数都保持默认。
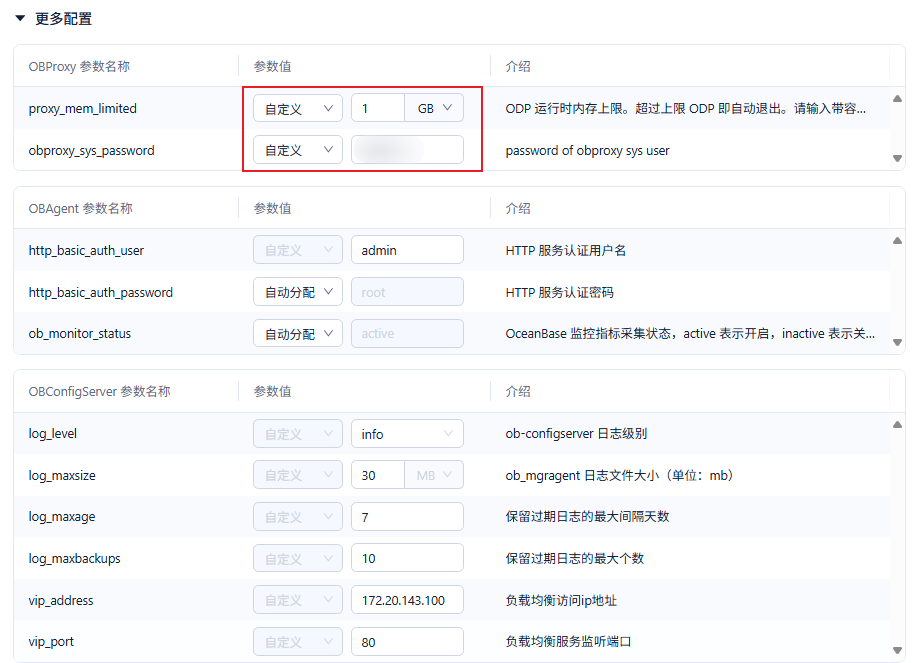
主要就是小内存环境限制一下 OBProxy 的内存。如果是生产环境,还要调大这个内存参数 proxy_mem_limited 。
后面参数按页面提示输入相应的。( 这里 vip_address 有个前端 BUG ,格式检查不过。可以收起这个“更多配置” 绕过这个问题
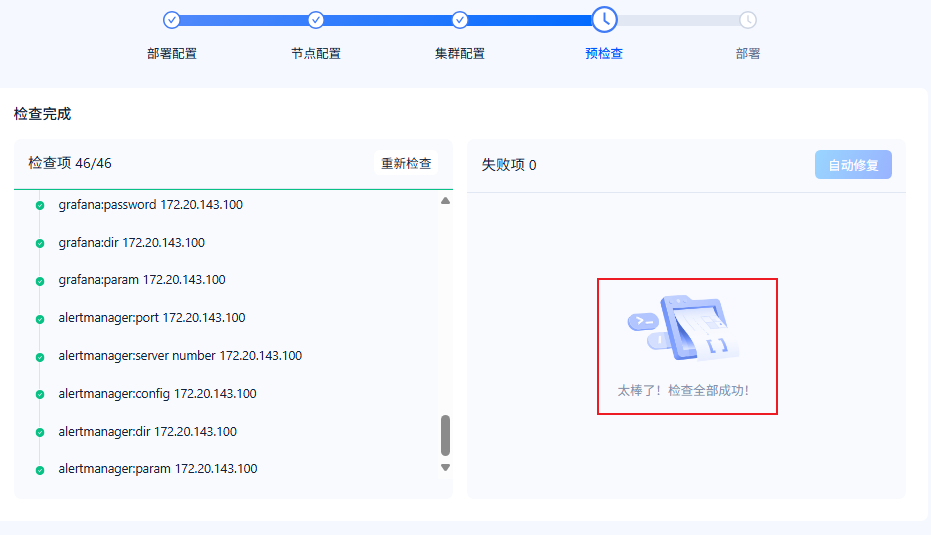
3.2.4 预检查

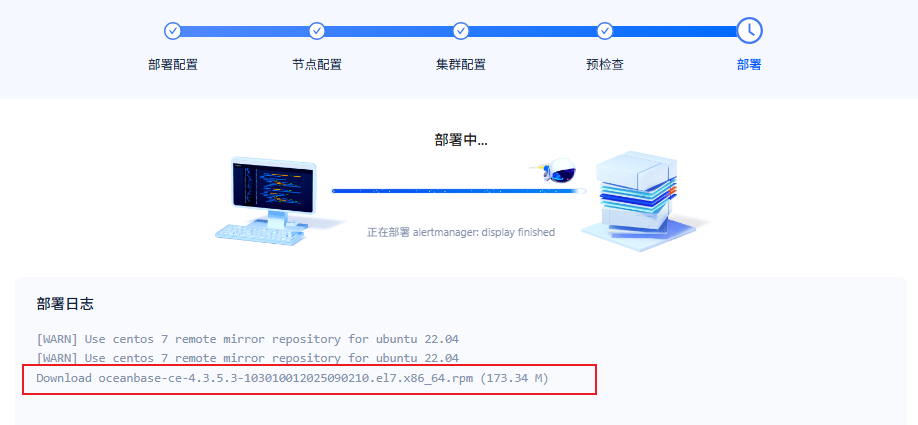
3.2.5 开始部署
点击下面的“部署按钮”。

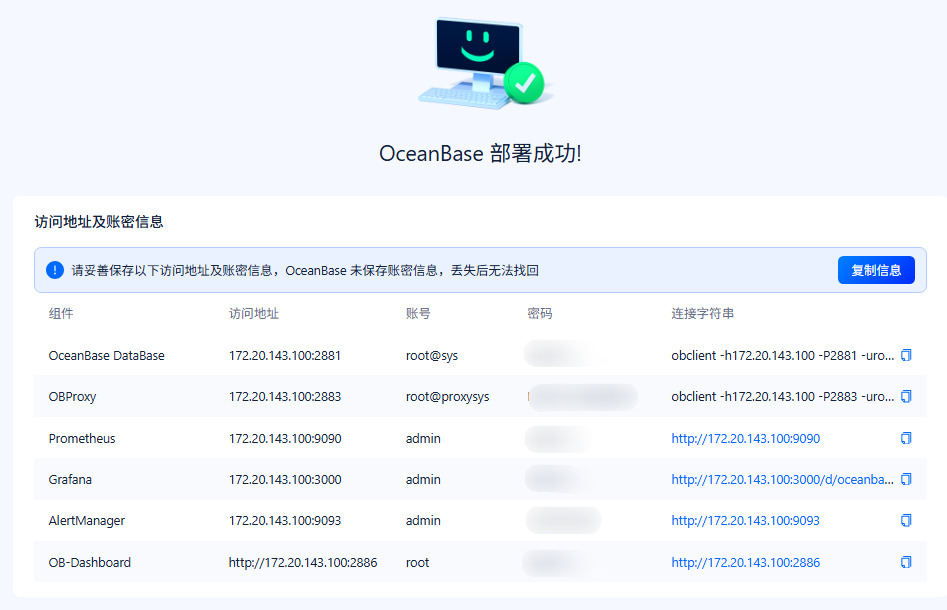
- 部署成功
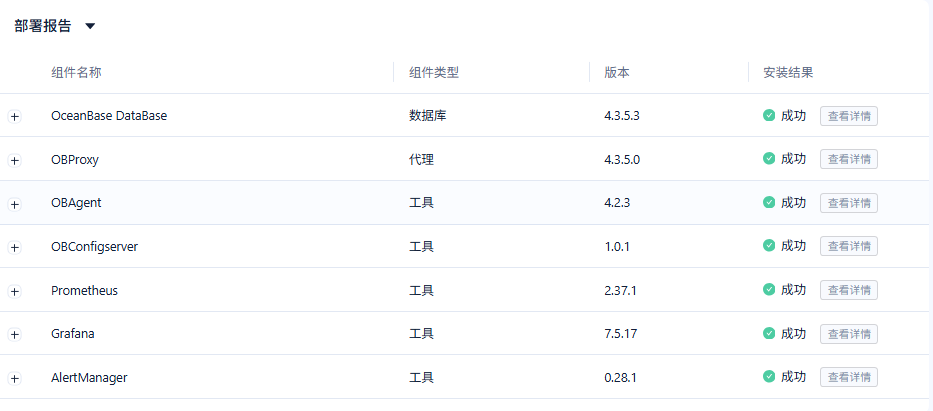
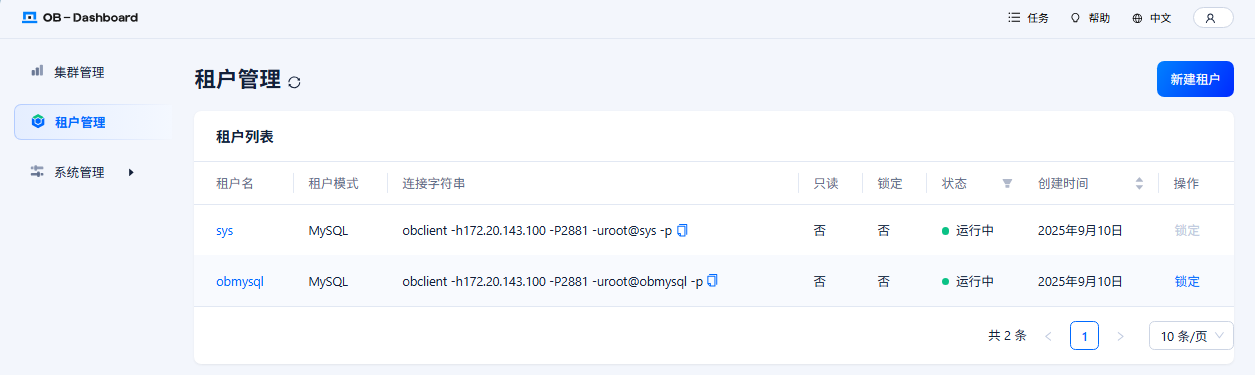
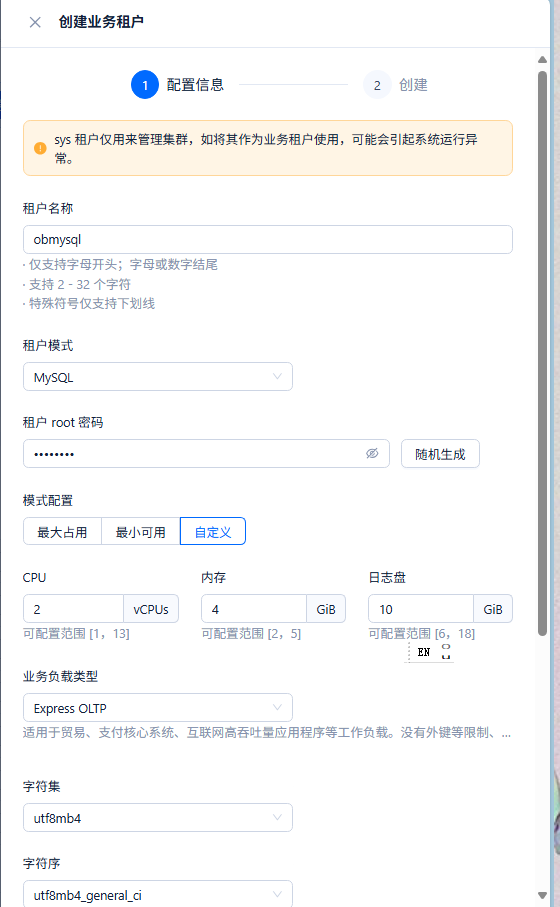
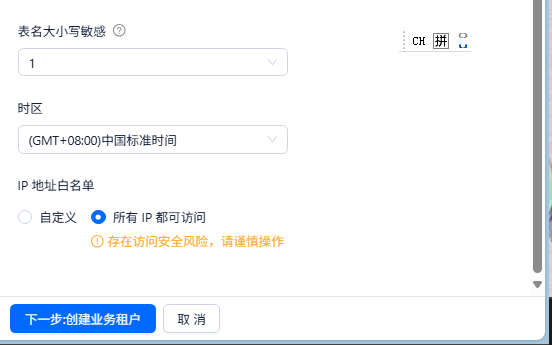
3.2.6 创建业务租户
创建成功如下。
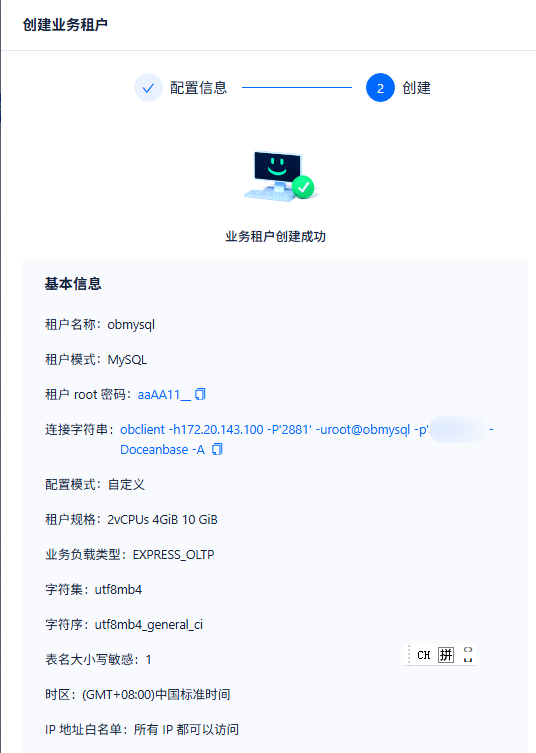
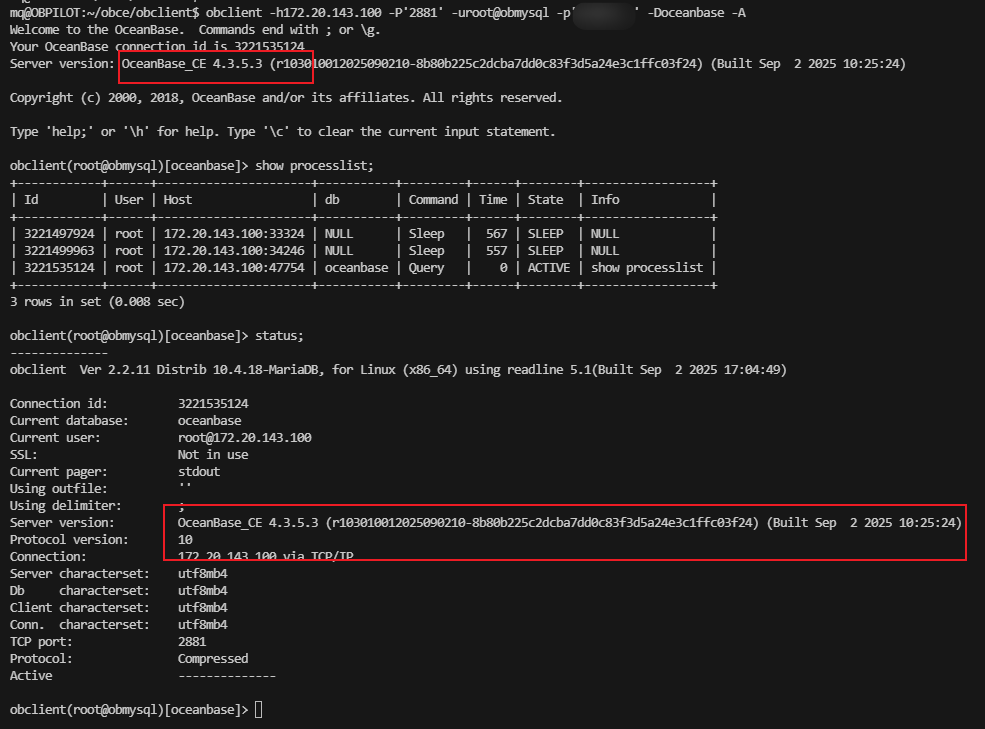
3.2.7 租户连接
验证租户连接需要命令obclient 。先安装一下。
mkdir obclient && cd obclient
rpm2cpio ../obclient-2.2.11-22025090217.el7.x86_64.rpm |cpio -idmv
sudo cp -r u01/obclient/bin/* /usr/local/bin/