ob社区版:4.5
SELECT COUNT(*) AS total
FROM t_cust_service a
JOIN t_cust b ON b.cust_id=a.cust_id
WHERE a.state IN (‘C’, ‘T’)
这个sql执行要2秒,查询的结果是9246,但从表结构上看
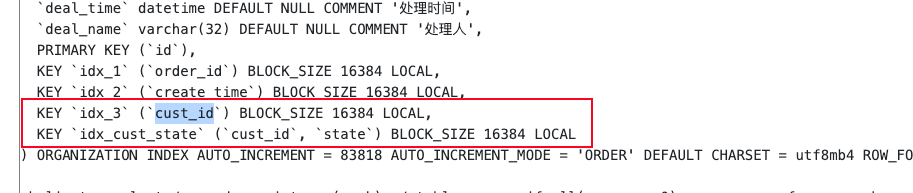
t_cust的cust_id是主键
t_cust_service 有一个复合索引(cust_id, state)
按说不应该慢
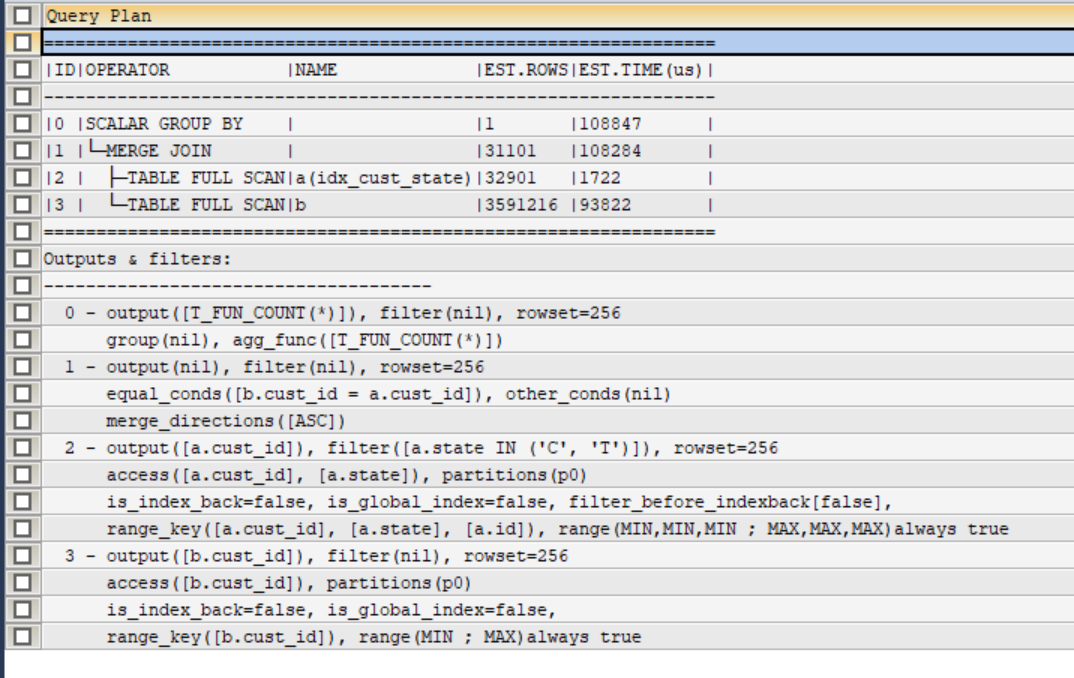
explain的显示:
ob社区版:4.5
SELECT COUNT(*) AS total
FROM t_cust_service a
JOIN t_cust b ON b.cust_id=a.cust_id
WHERE a.state IN (‘C’, ‘T’)
这个sql执行要2秒,查询的结果是9246,但从表结构上看
t_cust的cust_id是主键
t_cust_service 有一个复合索引(cust_id, state)
按说不应该慢
explain的显示:
复合索引换成( state,cust_id)试试呢
没效果
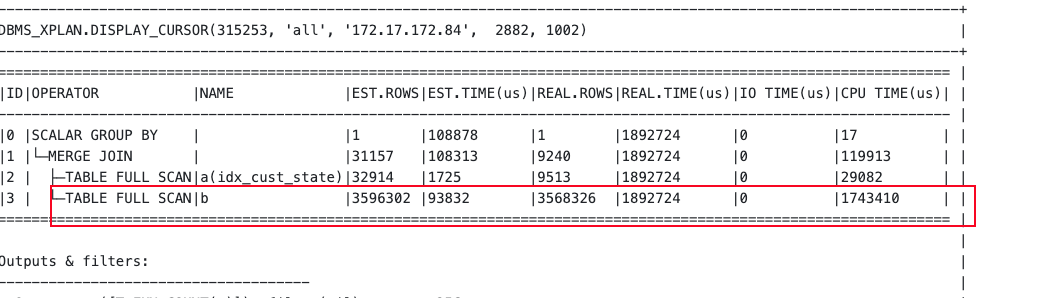
可以发一下xplan和DDL
收集下SQL性能问题信息吧
obdiag gather scene run --scene=observer.perf_sql [options]
https://www.oceanbase.com/docs/common-obdiag-cn-1000000003607733
看样子还是B表扫描的慢了,不如换成hash join试试
2秒还行啊,还得看数据量有多大
学习了
SELECT COUNT(*) AS total
FROM t_cust_service a
JOIN t_cust b ON b.cust_id=a.cust_id
WHERE a.cust_id IS NOT NULL AND a.state IN (‘C’, ‘T’)
这样执行,还是在2秒左右
要不在加个 index_ss 跳跃扫描试一下。 发下执行计划。
SELECT COUNT(*) AS total
FROM t_cust_service a
JOIN t_cust b ON b.cust_id=a.cust_id
WHERE a.cust_id IS NOT NULL AND a.state IN (‘C’, ‘T’);
你可以把两个表 分开查一下 看看执行的时间 看着t_cust是全表扫的
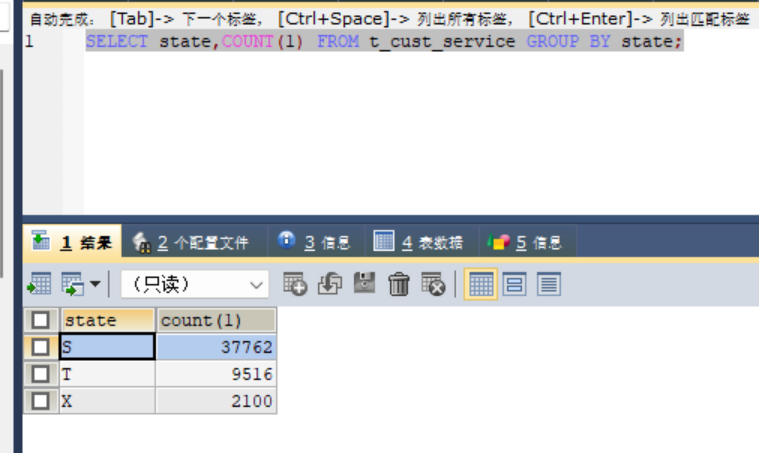
select state,count(1) FROM t_cust_service group by state;查一下 数据分布
索引冗余了 可以把inx3删除了
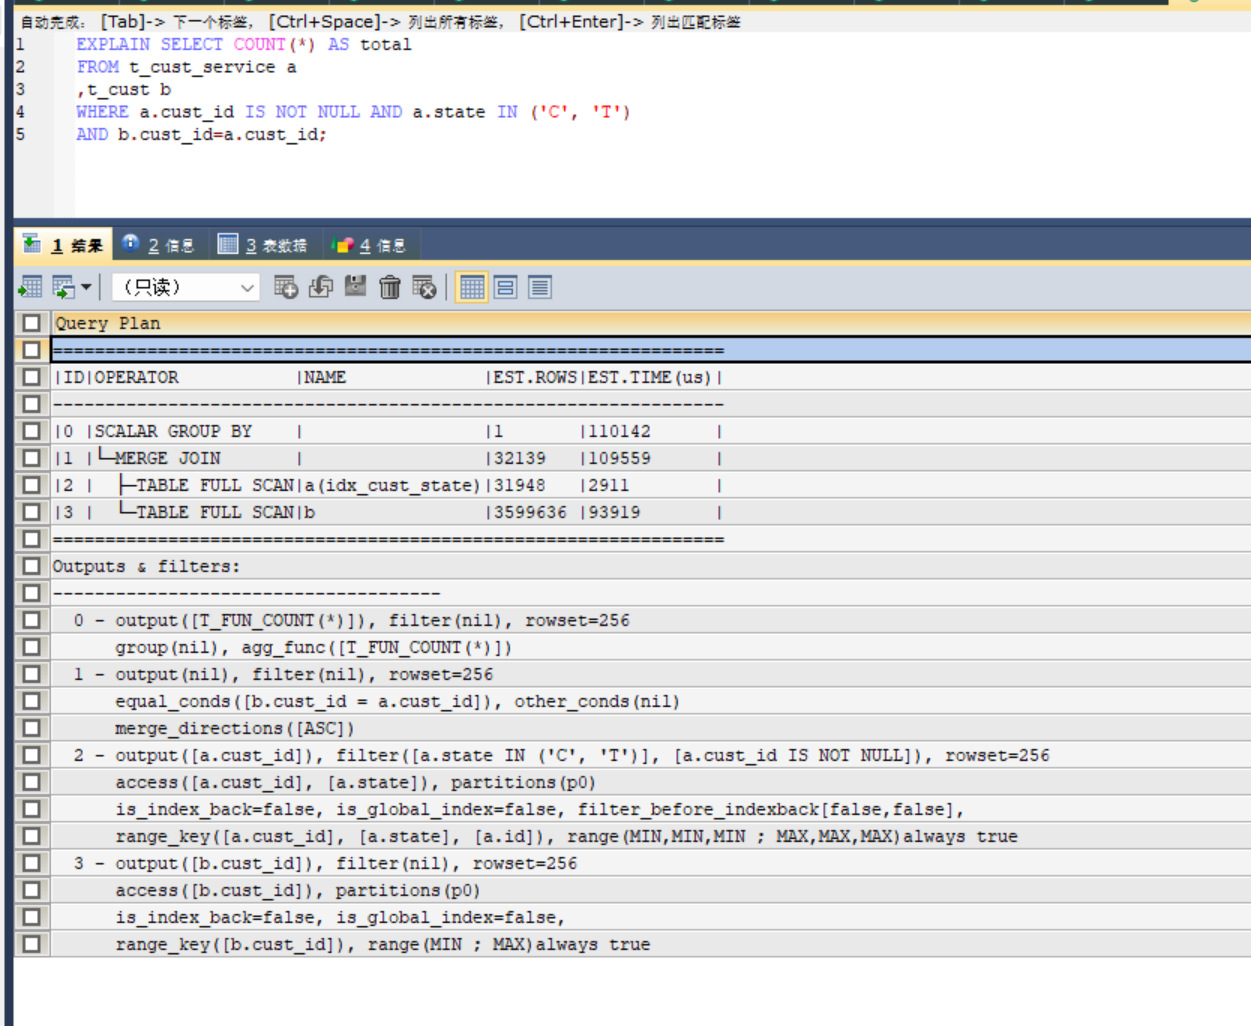
explain SELECT COUNT(*) AS total
FROM t_cust_service a
,t_cust b
WHERE a.cust_id IS NOT NULL AND a.state IN (‘C’, ‘T’)
and b.cust_id=a.cust_id;
这样子执行下看看
不慢啊…
学习了
从state分组数据来说 看着没有 state in (‘c’) 这个数据
SELECT * FROM t_cust_service a where a.state IN (‘C’, ‘T’);
select * from t_cust b;
select count(1) from t_cust b;
这样执行 一下 看看执行的时间 t_cust的数据量看一下