【 使用环境 】测试环境
【 OB使用版本 】4.2.5单机企业版
【问题描述】
通过alter system set memory_limit修改值为30后,重启被还原成了48了???
这个48是一开始安装单机版的时候设置的数值。后续想调整一下,发现无法调整。
使用的命令:
obclient(root@sys)[oceanbase]> alter system set memory_limit=‘30G’;
obclient(root@sys)[oceanbase]> ALTER SYSTEM SET memory_limit = ‘30G’ SCOPE = SPFILE;
重启集群均不生效。
【复现路径】
[root@ob oceanbase]# ps -ef|grep observer
root     16033     1 99 14:28 ?        00:01:51 /root/lnob/oceanbase/bin/observer -p 2881 -P 2882 -z zone1 -n lnob -c 1744258122 -d /data/1/lnob -I 192.168.207.18 -o __min_full_resource_pool_memory=1073741824,cluster_name=lnob,cpu_count=16,memory_limit=48G,datafile_size=2G,datafile_maxsize=2526G,log_disk_size=130G,system_memory=7G,enable_syslog_wf=False,max_syslog_file_count=16
root     17797 32362  0 14:28 pts/0    00:00:00 grep --color=auto observer
[root@ob oceanbase]# obclient -h192.168.207.18 -P2881 -uroot@sys -p'linux2025.' -Doceanbase -A
Welcome to the OceanBase.  Commands end with ; or \g.
Your OceanBase connection id is 3221536964
Server version: OceanBase 4.2.5.3 (r103000152025033110-f5b88cd987f23383677f2eb53cf76ed38a48979b) (Built Mar 31 2025 11:08:20)

Copyright (c) 2000, 2018, OceanBase and/or its affiliates. All rights reserved.

Type 'help;' or '\h' for help. Type '\c' to clear the current input statement.

obclient(root@sys)[oceanbase]> show parameters like '%memory%';
+-------+----------+----------------+----------+---------------------------------+-----------+------------+-------------------------------------------------------------------------------------------------------------------------------------------------------------------------+--------------+---------+---------+-------------------+---------------+-----------+
| zone  | svr_type | svr_ip         | svr_port | name                            | data_type | value      | info                                                                                                                                                                    | section      | scope   | source  | edit_level        | default_value | isdefault |
+-------+----------+----------------+----------+---------------------------------+-----------+------------+-------------------------------------------------------------------------------------------------------------------------------------------------------------------------+--------------+---------+---------+-------------------+---------------+-----------+
| zone1 | observer | 192.168.207.18 |     2882 | __min_full_resource_pool_memory | NULL      | 1073741824 | the min memory value which is specified for a full resource pool.                                                                                                       | LOAD_BALANCE | CLUSTER | DEFAULT | DYNAMIC_EFFECTIVE | 5368709120    |         0 |
| zone1 | observer | 192.168.207.18 |     2882 | memory_chunk_cache_size         | NULL      | 0M         | the maximum size of memory cached by memory chunk cache. Range: [0M,], 0 stands for adaptive                                                                            | OBSERVER     | CLUSTER | DEFAULT | DYNAMIC_EFFECTIVE | 0M            |         1 |
| zone1 | observer | 192.168.207.18 |     2882 | memory_limit_percentage         | NULL      | 60         | the size of the memory reserved for internal use(for testing purpose). Range: [10, 95]                                                                                  | OBSERVER     | CLUSTER | DEFAULT | DYNAMIC_EFFECTIVE | 80            |         0 |
| zone1 | observer | 192.168.207.18 |     2882 | system_memory                   | NULL      | 7G         | the memory reserved for internal use which cannot be allocated to any outer-tenant, and should be determined to guarantee every server functions normally. Range: [0M,) | OBSERVER     | CLUSTER | DEFAULT | DYNAMIC_EFFECTIVE | 0M            |         0 |
| zone1 | observer | 192.168.207.18 |     2882 | memory_limit                    | NULL      | 48G        | the size of the memory reserved for internal use(for testing purpose), 0 means follow memory_limit_percentage. Range: 0, [1G,).                                         | OBSERVER     | CLUSTER | DEFAULT | DYNAMIC_EFFECTIVE | 0M            |         0 |
| zone1 | observer | 192.168.207.18 |     2882 | memory_reserved                 | NULL      | 500M       | the size of the system memory reserved for emergency internal use. Range: [10M, total size of memory]                                                                   | SSTABLE      | CLUSTER | DEFAULT | DYNAMIC_EFFECTIVE | 500M          |         1 |
| zone1 | observer | 192.168.207.18 |     2882 | query_memory_limit_percentage   | NULL      | 50         | the percentage of tenant memory that can be used by a single SQL. The default value is 50. Range: [0,100]                                                               | OBSERVER     | TENANT  | DEFAULT | DYNAMIC_EFFECTIVE | 50            |         1 |
| zone1 | observer | 192.168.207.18 |     2882 | rpc_memory_limit_percentage     | NULL      | 0          | maximum memory for rpc in a tenant, as a percentage of total tenant memory, and 0 means no limit to rpc memory                                                          | RPC          | TENANT  | DEFAULT | DYNAMIC_EFFECTIVE | 0             |         1 |
+-------+----------+----------------+----------+---------------------------------+-----------+------------+-------------------------------------------------------------------------------------------------------------------------------------------------------------------------+--------------+---------+---------+-------------------+---------------+-----------+
8 rows in set (0.036 sec)

obclient(root@sys)[oceanbase]> alter system set memory_limit='30G';
Query OK, 0 rows affected (0.044 sec)

obclient(root@sys)[oceanbase]> show parameters like '%memory%';
+-------+----------+----------------+----------+---------------------------------+-----------+------------+-------------------------------------------------------------------------------------------------------------------------------------------------------------------------+--------------+---------+---------+-------------------+---------------+-----------+
| zone  | svr_type | svr_ip         | svr_port | name                            | data_type | value      | info                                                                                                                                                                    | section      | scope   | source  | edit_level        | default_value | isdefault |
+-------+----------+----------------+----------+---------------------------------+-----------+------------+-------------------------------------------------------------------------------------------------------------------------------------------------------------------------+--------------+---------+---------+-------------------+---------------+-----------+
| zone1 | observer | 192.168.207.18 |     2882 | __min_full_resource_pool_memory | NULL      | 1073741824 | the min memory value which is specified for a full resource pool.                                                                                                       | LOAD_BALANCE | CLUSTER | DEFAULT | DYNAMIC_EFFECTIVE | 5368709120    |         0 |
| zone1 | observer | 192.168.207.18 |     2882 | memory_chunk_cache_size         | NULL      | 0M         | the maximum size of memory cached by memory chunk cache. Range: [0M,], 0 stands for adaptive                                                                            | OBSERVER     | CLUSTER | DEFAULT | DYNAMIC_EFFECTIVE | 0M            |         1 |
| zone1 | observer | 192.168.207.18 |     2882 | memory_limit_percentage         | NULL      | 60         | the size of the memory reserved for internal use(for testing purpose). Range: [10, 95]                                                                                  | OBSERVER     | CLUSTER | DEFAULT | DYNAMIC_EFFECTIVE | 80            |         0 |
| zone1 | observer | 192.168.207.18 |     2882 | system_memory                   | NULL      | 7G         | the memory reserved for internal use which cannot be allocated to any outer-tenant, and should be determined to guarantee every server functions normally. Range: [0M,) | OBSERVER     | CLUSTER | DEFAULT | DYNAMIC_EFFECTIVE | 0M            |         0 |
| zone1 | observer | 192.168.207.18 |     2882 | memory_limit                    | NULL      | 30G        | the size of the memory reserved for internal use(for testing purpose), 0 means follow memory_limit_percentage. Range: 0, [1G,).                                         | OBSERVER     | CLUSTER | DEFAULT | DYNAMIC_EFFECTIVE | 0M            |         0 |
| zone1 | observer | 192.168.207.18 |     2882 | memory_reserved                 | NULL      | 500M       | the size of the system memory reserved for emergency internal use. Range: [10M, total size of memory]                                                                   | SSTABLE      | CLUSTER | DEFAULT | DYNAMIC_EFFECTIVE | 500M          |         1 |
| zone1 | observer | 192.168.207.18 |     2882 | query_memory_limit_percentage   | NULL      | 50         | the percentage of tenant memory that can be used by a single SQL. The default value is 50. Range: [0,100]                                                               | OBSERVER     | TENANT  | DEFAULT | DYNAMIC_EFFECTIVE | 50            |         1 |
| zone1 | observer | 192.168.207.18 |     2882 | rpc_memory_limit_percentage     | NULL      | 0          | maximum memory for rpc in a tenant, as a percentage of total tenant memory, and 0 means no limit to rpc memory                                                          | RPC          | TENANT  | DEFAULT | DYNAMIC_EFFECTIVE | 0             |         1 |
+-------+----------+----------------+----------+---------------------------------+-----------+------------+-------------------------------------------------------------------------------------------------------------------------------------------------------------------------+--------------+---------+---------+-------------------+---------------+-----------+
8 rows in set (0.008 sec)

obclient(root@sys)[oceanbase]> ALTER SYSTEM SET memory_limit = '30G' SCOPE = SPFILE;
Query OK, 0 rows affected (0.011 sec)

obclient(root@sys)[oceanbase]>  select TENANT_ID,hold/1024/1024/1024,free/1024/1024/1024 from V$OB_TENANT_MEMORY;
+-----------+---------------------+-------------------------+
| TENANT_ID | hold/1024/1024/1024 | free/1024/1024/1024     |
+-----------+---------------------+-------------------------+
|         1 |      0.954219818115 |          3.045780181885 |
|       500 |      0.722351074219 | 8589934591.277648924850 |
|       508 |      0.033847808838 |          0.966152191162 |
|      1003 |      0.675781250000 |          1.724218749440 |
|      1004 |      1.177825927734 |         20.422174072824 |
+-----------+---------------------+-------------------------+
5 rows in set (0.019 sec)

obclient(root@sys)[oceanbase]> SELECT    t.tenant_name,   u.zone,   u.svr_ip,   u.max_cpu AS "CPU配额(核)",   u.memory_size/1024/1024/1024 AS "内存配额(GB)",   u.log_disk_size/1024/1024/1024 AS "日志盘配额(GB)",   u.data_disk_in_use/1024/1024/1024 AS "数据盘已用(GB)" FROM oceanbase.GV$OB_UNITS u JOIN oceanbase.DBA_OB_TENANTS t ON u.tenant_id = t.tenant_id ORDER BY t.tenant_name, u.zone;
+-------------+-------+----------------+----------------+------------------+---------------------+---------------------+
| tenant_name | zone  | svr_ip         | CPU配额(核)    | 内存配额(GB)     | 日志盘配额(GB)      | 数据盘已用(GB)      |
+-------------+-------+----------------+----------------+------------------+---------------------+---------------------+
| lnzyob      | zone1 | 192.168.207.18 |             12 |  21.600000000559 |    112.500000000000 |      0.000000000000 |
| META$1004   | zone1 | 192.168.207.18 |           NULL |   2.399999999440 |     12.500000000000 |      0.000000000000 |
| sys         | zone1 | 192.168.207.18 |              3 |   1.000000000000 |      4.000000000000 |      0.000000000000 |
+-------------+-------+----------------+----------------+------------------+---------------------+---------------------+
3 rows in set (0.021 sec)

obclient(root@sys)[oceanbase]> exit
Bye
[root@ob oceanbase]# obd cluster stop lnob
Get local repositories ok
Get local repositories and plugins ok
Open ssh connection ok
Stop observer ok
Stop obshell ok
Stop obagent ok
Stop prometheus ok
Stop grafana ok
lnob stopped
Trace ID: 4eaf915e-1e7a-11f0-a191-0050569f2a5c
If you want to view detailed obd logs, please run: obd display-trace 4eaf915e-1e7a-11f0-a191-0050569f2a5c
[root@ob oceanbase]# ps -ef|grep ob
root     18784 32362  0 14:32 pts/0    00:00:00 grep --color=auto ob
[root@ob oceanbase]# obd cluster stop ^Cob
[root@ob oceanbase]# free -g
              total        used        free      shared  buff/cache   available
Mem:             62           1          57           0           3          60
Swap:            31           0          31
[root@ob oceanbase]# obd cluster start lnob
Get local repositories ok
Load cluster param plugin ok
Open ssh connection ok
Check before start obagent ok
Check before start prometheus ok
Check before start grafana ok
cluster scenario: None
Start observer ok
observer program health check ok
Connect to observer 192.168.207.18:2881 ok
obshell start ok
obshell program health check ok
Start obagent ok
obagent program health check ok
Start promethues ok
prometheus program health check ok
Start grafana ok
grafana program health check ok
Connect to grafana ok
Grafana modify password ok
Connect to observer 192.168.207.18:2881 ok
Wait for observer init ok
+--------------------------------------------------+
|               oceanbase-standalone               |
+----------------+---------+------+-------+--------+
| ip             | version | port | zone  | status |
+----------------+---------+------+-------+--------+
| 192.168.207.18 | 4.2.5.3 | 2881 | zone1 | ACTIVE |
+----------------+---------+------+-------+--------+
obclient -h192.168.207.18 -P2881 -uroot@sys -p'linux2025.' -Doceanbase -A

cluster unique id: 3401ae25-58c4-5b35-8eb3-c88c207ad7e8-1961de3d3c0-03050204

Connect to Obagent ok
+-------------------------------------------------------------------+
|                              obagent                              |
+----------------+--------------------+--------------------+--------+
| ip             | mgragent_http_port | monagent_http_port | status |
+----------------+--------------------+--------------------+--------+
| 192.168.207.18 | 8089               | 8088               | active |
+----------------+--------------------+--------------------+--------+
Connect to Prometheus ok
+----------------------------------------------------------+
|                        prometheus                        |
+----------------------------+-------+------------+--------+
| url                        | user  | password   | status |
+----------------------------+-------+------------+--------+
| http://192.168.207.18:9090 | admin | 489VKvcUur | active |
+----------------------------+-------+------------+--------+
Connect to grafana ok
+---------------------------------------------------------------------+
|                               grafana                               |
+----------------------------------------+-------+-----------+--------+
| url                                    | user  | password  | status |
+----------------------------------------+-------+-----------+--------+
| http://192.168.207.18:3000/d/oceanbase | admin | oceanbase | active |
+----------------------------------------+-------+-----------+--------+
lnob running
Trace ID: 5d750926-1e7a-11f0-ad2a-0050569f2a5c
If you want to view detailed obd logs, please run: obd display-trace 5d750926-1e7a-11f0-ad2a-0050569f2a5c
[root@ob oceanbase]# ps -ef|grep ob
root     18903     1 99 14:32 ?        00:01:38 /root/lnob/oceanbase/bin/observer -p 2881 -P 2882 -z zone1 -n lnob -c 1744258122 -d /data/1/lnob -I 192.168.207.18 -o __min_full_resource_pool_memory=1073741824,cluster_name=lnob,cpu_count=16,memory_limit=48G,datafile_size=2G,datafile_maxsize=2526G,log_disk_size=130G,system_memory=7G,enable_syslog_wf=False,max_syslog_file_count=16
root     20008     1  0 14:32 pts/0    00:00:00 /root/lnob/oceanbase/bin/obshell daemon --ip 192.168.207.18 --port 2886
root     20050 20008  0 14:32 pts/0    00:00:00 /root/lnob/oceanbase/bin/obshell server --ip 192.168.207.18 --port 2886
root     20137     1  0 14:32 ?        00:00:00 /root/lnob/obagent/bin/ob_agentd -c /root/lnob/obagent/conf/agentd.yaml
root     20143 20137  0 14:32 ?        00:00:00 /root/lnob/obagent/bin/ob_mgragent
root     20144 20137  0 14:32 ?        00:00:00 /root/lnob/obagent/bin/ob_monagent
root     20250     1  0 14:32 pts/0    00:00:00 bash prometheusd.sh --config.file=/root/lnob/prometheus/prometheus.yaml --web.listen-address=0.0.0.0:9090 --storage.tsdb.path=/root/lnob/prometheus/data --web.enable-lifecycle --web.config.file=/root/lnob/prometheus/web_config.yaml --daemon
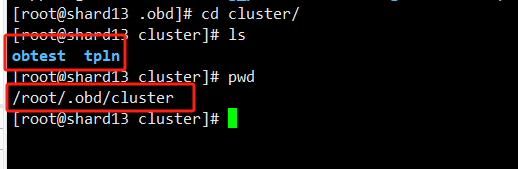
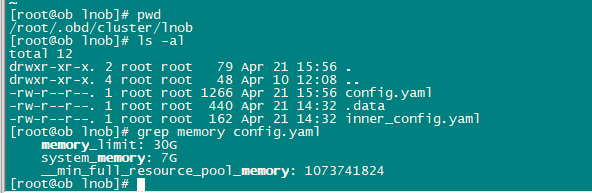
采用集群启停的方式,难道默认会调用某个固定的参数文件吗?这个文件在什么位置呢?没找到。请专家解惑,谢谢!
[root@ob oceanbase]# obd cluster stop lnob
[root@ob oceanbase]# obd cluster start lnob