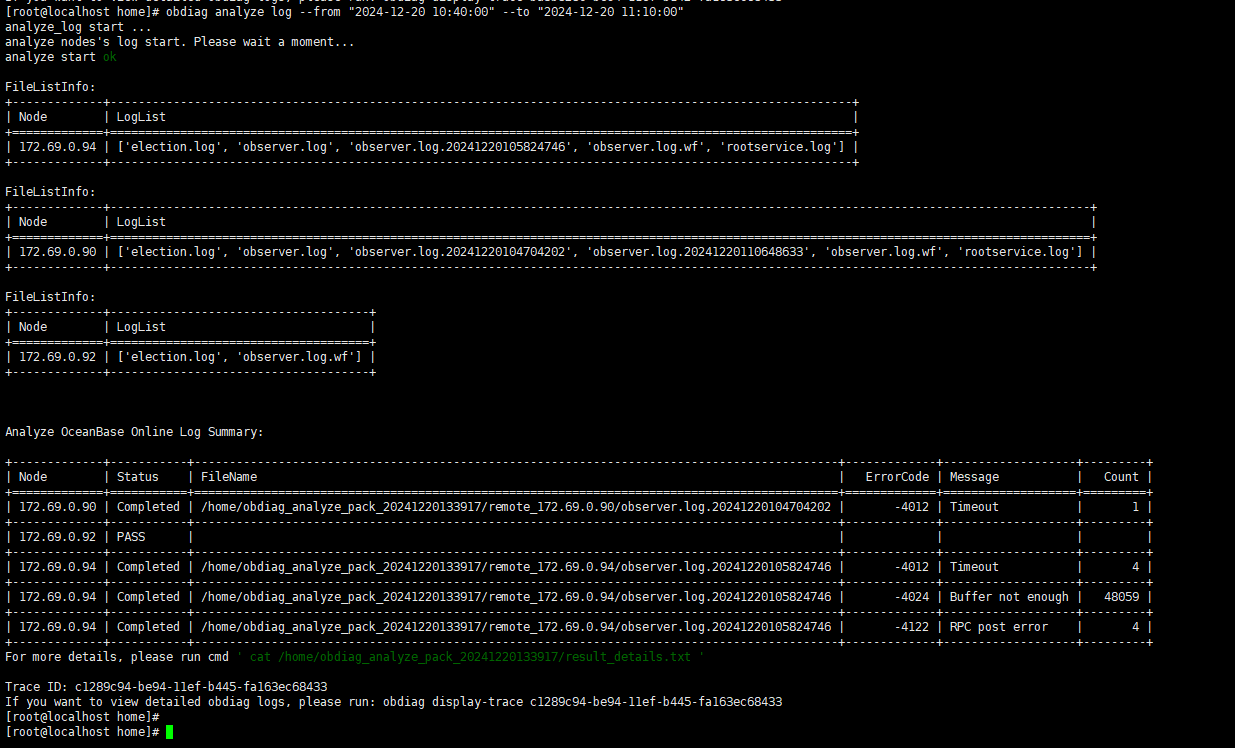
部署集群后节点observer进程相继中断,使用obdiag check提示如下,这是什么问题导致的?

【 使用环境 】 测试环境
【 OB or 其他组件 】OB
【 使用版本 】4.3.4
【问题描述】部署集群后节点observer进程相继中断,使用obdiag check提示如下,这是什么问题导致的?
【附件及日志】
[root@localhost home]# obdiag check
check start …
[WARN] ./check_report/ not exists. mkdir it!
[WARN] step_base ResultFalseException:ip:172.69.0.90 ,data_dir and log_dir_disk are on the same disk.
[WARN] step_base ResultFalseException:ip:172.69.0.92 ,data_dir and log_dir_disk are on the same disk.
[WARN] step_base ResultFalseException:ip:172.69.0.94 ,data_dir and log_dir_disk are on the same disk.
[WARN] TaskBase execute StepResultFailException: ip:172.69.0.90 ,data_dir and log_dir_disk are on the same disk.
[WARN] TaskBase execute StepResultFailException: ip:172.69.0.92 ,data_dir and log_dir_disk are on the same disk.
[WARN] TaskBase execute StepResultFailException: ip:172.69.0.94 ,data_dir and log_dir_disk are on the same disk.
[WARN] step_base ResultFalseException:There is 1 not_ACTIVE observer, please check as soon as possible.
[WARN] TaskBase execute StepResultFailException: There is 1 not_ACTIVE observer, please check as soon as possible.
[WARN] step_base ResultFalseException:There is 1 not_ACTIVE observer, please check as soon as possible.
[WARN] step_base ResultFalseException:There is 1 not_ACTIVE observer, please check as soon as possible.
[WARN] TaskBase execute StepResultFailException: There is 1 not_ACTIVE observer, please check as soon as possible. [WARN] TaskBase execute StepResultFailException: There is 1 not_ACTIVE observer, please check as soon as possible.

[WARN] step_base ResultFalseException:The collection of statistical information related to tenants has issues… Please check the tenant_ids: 1
[WARN] TaskBase execute StepResultFailException: The collection of statistical information related to tenants has issues… Please check the tenant_ids: 1
[WARN] step_base ResultFalseException:The collection of statistical information related to tenants has issues… Please check the tenant_ids: 1
[WARN] TaskBase execute StepResultFailException: The collection of statistical information related to tenants has issues… Please check the tenant_ids: 1
[WARN] step_base ResultFalseException:The collection of statistical information related to tenants has issues… Please check the tenant_ids: 1
[WARN] TaskBase execute StepResultFailException: The collection of statistical information related to tenants has issues… Please check the tenant_ids: 1
[WARN] step_base ResultFalseException:tsar is not installed. we can not check tcp retransmission.
[WARN] step_base ResultFalseException:tsar is not installed. we can not check tcp retransmission.
[WARN] step_base ResultFalseException:tsar is not installed. we can not check tcp retransmission.
[WARN] TaskBase execute StepResultFailException: tsar is not installed. we can not check tcp retransmission.
[WARN] TaskBase execute StepResultFailException: tsar is not installed. we can not check tcp retransmission.
[WARN] TaskBase execute StepResultFailException: tsar is not installed. we can not check tcp retransmission.
[WARN] step_base ResultFalseException:ip_local_port_range_min : 32768. recommended: 3500
[WARN] step_base ResultFalseException:ip_local_port_range_min : 32768. recommended: 3500
[WARN] step_base ResultFalseException:ip_local_port_range_min : 32768. recommended: 3500
[WARN] TaskBase execute StepResultFalseException: ip_local_port_range_min : 32768. recommended: 3500 .
[WARN] TaskBase execute StepResultFalseException: ip_local_port_range_min : 32768. recommended: 3500 .
[WARN] step_base ResultFalseException:ip_local_port_range_max : 60999. recommended: 65535
[WARN] step_base ResultFalseException:ip_local_port_range_max : 60999. recommended: 65535
[WARN] TaskBase execute StepResultFalseException: ip_local_port_range_min : 32768. recommended: 3500 .
[WARN] step_base ResultFalseException:ip_local_port_range_max : 60999. recommended: 65535
[WARN] TaskBase execute StepResultFalseException: ip_local_port_range_max : 60999. recommended: 65535 .
[WARN] TaskBase execute StepResultFalseException: ip_local_port_range_max : 60999. recommended: 65535 .
[WARN] TaskBase execute StepResultFalseException: ip_local_port_range_max : 60999. recommended: 65535 .
[WARN] step_base ResultFalseException:On ip : 172.69.0.92, ulimit -u is 655350 . recommended: 655360.
[WARN] TaskBase execute StepResultFalseException: On ip : 172.69.0.92, ulimit -u is 655350 . recommended: 655360. .
Check obproxy finished. For more details, please run cmd ’ cat ./check_report/obdiag_check_report_obproxy_2024-12-20-11-03-20.table ’
Check observer finished. For more details, please run cmd’ cat ./check_report/obdiag_check_report_observer_2024-12-20-11-03-22.table ’
Trace ID: f6c57c3e-be7e-11ef-8f92-fa163ec68433
If you want to view detailed obdiag logs, please run: obdiag display-trace f6c57c3e-be7e-11ef-8f92-fa163ec68433

这是obdiag check执行的日志,把结果文件发出来看看
./check_report/obdiag_check_report_obproxy_2024-12-20-11-03-20.table ’
./check_report/obdiag_check_report_observer_2024-12-20-11-03-22.table ’

从日志里面大概看了下有几点需要注意:

  1. 你的数据盘和日志盘同盘部署了,这个是ob部署的时候极度想要避免的。
  2. 有发现一个节点不正常
  3. 统计信息好像也有点问题

总之把报告发出来,里面有详细的细节

1 个赞

另外现在节点是都挂了吗

3个挂了两个

1 个赞

那这个集群应该是不可用了,这种情况下巡检意义也不大。直接obdiag analyze log 分析出事的时候的日志看看有哪些问题吧。
例如:

obdiag analyze log --from "2023-10-08 10:25:00" --to "2023-10-08 11:30:00" \
  --config obcluster.servers.nodes[0].ip=xx.xx.xx.1 \
  --config obcluster.servers.nodes[1].ip=xx.xx.xx.xx.2 \
  --config obcluster.servers.global.ssh_username=test \
  --config obcluster.servers.global.ssh_password=****** \
  --config obcluster.servers.global.home_path=/home/admin/oceanbase


obdiag.zip (1.8 KB)

从目前的错误码看可能是空间不足,麻烦将挂掉的那个节点的observer.log上传下再看看

4122


https://www.oceanbase.com/knowledge-base/oceanbase-database-1000000000702110?back=kb

1 个赞

observer.7z (5.8 MB)
请您看一下

IO error

[2024-12-20 13:37:56.640773] WDIAG [COMMON] wait (ob_io_define.cpp:1877) [56064][observer][T0][Y0-0000000000000001-0-0] [lt=58][errcode=-4224] IO error, (ret=-4224, *result_={is_inited_:true, is_finished_:true, is_canceled_:false, has_estimated_:false, complete_size_:20480, offset_:0, size_:66060288, timeout_us_:10000000, result_ref_cnt_:1, out_ref_cnt_:1, flag_:{mode:"READ", group_id_:0, func_type_:0, wait_event_id_:3, is_sync_:false, is_unlimited_:false, is_detect_:false, is_write_through_:false, is_sealed_:true, is_time_detect_:false, need_close_dev_and_fd_:false, reserved_:0}, ret_code_:{io_ret_:-4224, fs_errno_:0}, tenant_id_:500, tenant_io_mgr_:{ptr:0x2b3d0f7cc030}, user_data_buf_:0x2b3d3dc05000, buf_:null, io_callback_:null, time_log:{begin_ts:1734673076639231, enqueue_used:-1, dequeue_used:-1, submit_used:1734673076640516, return_used:11, callback_enqueue_used:-1, callback_dequeue_used:-1, callback_finish_used:-1, end_used:1734673076640679}})

[2024-12-20 13:37:56.642649] WDIAG [COMMON] wait (ob_io_define.cpp:1877) [56064][observer][T0][Y0-0000000000000001-0-0] [lt=8][errcode=-4224] IO error, (ret=-4224, *result_={is_inited_:true, is_finished_:true, is_canceled_:false, has_estimated_:false, complete_size_:0, offset_:20480, size_:66060288, timeout_us_:10000000, result_ref_cnt_:1, out_ref_cnt_:1, flag_:{mode:"READ", group_id_:0, func_type_:0, wait_event_id_:3, is_sync_:false, is_unlimited_:false, is_detect_:false, is_write_through_:false, is_sealed_:true, is_time_detect_:false, need_close_dev_and_fd_:false, reserved_:0}, ret_code_:{io_ret_:-4224, fs_errno_:0}, tenant_id_:500, tenant_io_mgr_:{ptr:0x2b3d0f7cc030}, user_data_buf_:0x2b3d3dc05000, buf_:null, io_callback_:null, time_log:{begin_ts:1734673076642105, enqueue_used:-1, dequeue_used:-1, submit_used:1734673076642186, return_used:75, callback_enqueue_used:-1, callback_dequeue_used:-1, callback_finish_used:-1, end_used:1734673076642608}})

[2024-12-20 13:37:56.643330] WDIAG [COMMON] wait (ob_io_define.cpp:1877) [56064][observer][T0][Y0-0000000000000001-0-0] [lt=47][errcode=-4224] IO error, (ret=-4224, *result_={is_inited_:true, is_finished_:true, is_canceled_:false, has_estimated_:false, complete_size_:0, offset_:0, size_:66060288, timeout_us_:10000000, result_ref_cnt_:1, out_ref_cnt_:1, flag_:{mode:"READ", group_id_:0, func_type_:0, wait_event_id_:3, is_sync_:false, is_unlimited_:false, is_detect_:false, is_write_through_:false, is_sealed_:true, is_time_detect_:false, need_close_dev_and_fd_:false, reserved_:0}, ret_code_:{io_ret_:-4224, fs_errno_:0}, tenant_id_:500, tenant_io_mgr_:{ptr:0x2b3d0f7cc030}, user_data_buf_:0x2b3d3dc05000, buf_:null, io_callback_:null, time_log:{begin_ts:1734673076642889, enqueue_used:-1, dequeue_used:-1, submit_used:1734673076642958, return_used:67, callback_enqueue_used:-1, callback_dequeue_used:-1, callback_finish_used:-1, end_used:1734673076643295}})

[2024-12-20 13:37:57.573417] WDIAG [COMMON] wait (ob_io_define.cpp:1877) [56064][observer][T1][Y0-0000000000000001-0-0] [lt=9][errcode=-4224] IO error, (ret=-4224, *result_={is_inited_:true, is_finished_:true, is_canceled_:false, has_estimated_:false, complete_size_:135168, offset_:0, size_:66060288, timeout_us_:10000000, result_ref_cnt_:1, out_ref_cnt_:1, flag_:{mode:"READ", group_id_:0, func_type_:12, wait_event_id_:3, is_sync_:false, is_unlimited_:false, is_detect_:false, is_write_through_:false, is_sealed_:true, is_time_detect_:false, need_close_dev_and_fd_:false, reserved_:0}, ret_code_:{io_ret_:-4224, fs_errno_:0}, tenant_id_:1, tenant_io_mgr_:{ptr:0x2b3d0e9f0030}, user_data_buf_:0x2b3d56605000, buf_:null, io_callback_:null, time_log:{begin_ts:1734673077571064, enqueue_used:18, dequeue_used:85, submit_used:1595, return_used:21, callback_enqueue_used:-1, callback_dequeue_used:-1, callback_finish_used:-1, end_used:1734673077573381}})

[2024-12-20 13:37:57.602075] WDIAG [COMMON] wait (ob_io_define.cpp:1877) [56064][observer][T1][Y0-0000000000000001-0-0] [lt=8][errcode=-4224] IO error, (ret=-4224, *result_={is_inited_:true, is_finished_:true, is_canceled_:false, has_estimated_:false, complete_size_:0, offset_:135168, size_:66060288, timeout_us_:10000000, result_ref_cnt_:1, out_ref_cnt_:1, flag_:{mode:"READ", group_id_:0, func_type_:12, wait_event_id_:3, is_sync_:false, is_unlimited_:false, is_detect_:false, is_write_through_:false, is_sealed_:true, is_time_detect_:false, need_close_dev_and_fd_:false, reserved_:0}, ret_code_:{io_ret_:-4224, fs_errno_:0}, tenant_id_:1, tenant_io_mgr_:{ptr:0x2b3d0e9f0030}, user_data_buf_:0x2b3d56605000, buf_:null, io_callback_:null, time_log:{begin_ts:1734673077601501, enqueue_used:10, dequeue_used:54, submit_used:74, return_used:57, callback_enqueue_used:-1, callback_dequeue_used:-1, callback_finish_used:-1, end_used:1734673077602037}})

[2024-12-20 13:37:57.603647] WDIAG [COMMON] wait (ob_io_define.cpp:1877) [56064][observer][T1][Y0-0000000000000001-0-0] [lt=10][errcode=-4224] IO error, (ret=-4224, *result_={is_inited_:true, is_finished_:true, is_canceled_:false, has_estimated_:false, complete_size_:8192, offset_:0, size_:66060288, timeout_us_:10000000, result_ref_cnt_:1, out_ref_cnt_:1, flag_:{mode:"READ", group_id_:0, func_type_:12, wait_event_id_:3, is_sync_:false, is_unlimited_:false, is_detect_:false, is_write_through_:false, is_sealed_:true, is_time_detect_:false, need_close_dev_and_fd_:false, reserved_:0}, ret_code_:{io_ret_:-4224, fs_errno_:0}, tenant_id_:1, tenant_io_mgr_:{ptr:0x2b3d0e9f0030}, user_data_buf_:0x2b3d56605000, buf_:null, io_callback_:null, time_log:{begin_ts:1734673077602264, enqueue_used:5, dequeue_used:58, submit_used:1079, return_used:12, callback_enqueue_used:-1, callback_dequeue_used:-1, callback_finish_used:-1, end_used:1734673077603615}})

[2024-12-20 13:37:57.605033] WDIAG [COMMON] wait (ob_io_define.cpp:1877) [56064][observer][T1][Y0-0000000000000001-0-0] [lt=7][errcode=-4224] IO error, (ret=-4224, *result_={is_inited_:true, is_finished_:true, is_canceled_:false, has_estimated_:false, complete_size_:0, offset_:8192, size_:66060288, timeout_us_:10000000, result_ref_cnt_:1, out_ref_cnt_:1, flag_:{mode:"READ", group_id_:0, func_type_:12, wait_event_id_:3, is_sync_:false, is_unlimited_:false, is_detect_:false, is_write_through_:false, is_sealed_:true, is_time_detect_:false, need_close_dev_and_fd_:false, reserved_:0}, ret_code_:{io_ret_:-4224, fs_errno_:0}, tenant_id_:1, tenant_io_mgr_:{ptr:0x2b3d0e9f0030}, user_data_buf_:0x2b3d56605000, buf_:null, io_callback_:null, time_log:{begin_ts:1734673077604657, enqueue_used:4, dequeue_used:56, submit_used:60, return_used:35, callback_enqueue_used:-1, callback_dequeue_used:-1, callback_finish_used:-1, end_used:1734673077605011}})


data_disk_size:0

[2024-12-20 13:37:56.643771] INFO  [STORAGE] apply_replay_result_ (ob_server_storage_meta_replayer.cpp:108) [56064][observer][T0][Y0-0000000000000001-0-0] [lt=23] replay tenant result(tenant_id=1, tenant_meta={unit:{tenant_id:1, unit_id:3, has_memstore:true, unit_status:"NORMAL", config:{unit_config_id:1, name:"sys_unit_config", resource:{min_cpu:3, max_cpu:3, memory_size:"2GB", log_disk_size:"6GB", data_disk_size:0, min_iops:9223372036854775807, max_iops:9223372036854775807, iops_weight:3, max_net_bandwidth:INT64_MAX, net_bandwidth_weight:3, }}, mode:0, create_timestamp:1734594320042036, is_removed:false, hidden_sys_data_disk_config_size:0}, super_block:{tenant_id:1, replay_start_point:ObLogCursor{file_id=1, log_id=1, offset=0}, ls_meta_entry:{[ver=1,mode=0,seq=0][2nd=18446744073709551615]}, tablet_meta_entry:{[ver=1,mode=0,seq=0][2nd=18446744073709551615]}, is_hidden:false, version:4, snapshot_cnt:0, preallocated_seqs:{object_seq:60000, tmp_file_seq:60000, write_seq:60000}, auto_inc_ls_epoch:0, ls_cnt:0}, create_status:1, epoch:0})

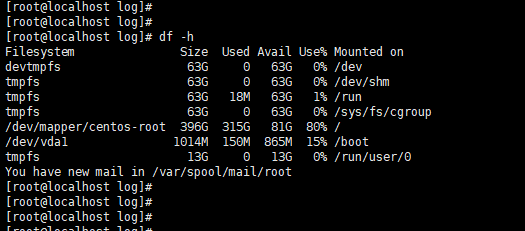
是有大量IO error,你发下yaml配置文件 以及系统的 df -h

user:
username: root
password: HbHgT7KsaasE
port: 22
oceanbase-ce:
version: 4.3.4.0
release: 100000162024110717.el7
package_hash: 5d59e837a0ecff1a6baa20f72747c343ac7c8dce
172.69.0.90:
zone: zone1
172.69.0.92:
zone: zone2
172.69.0.94:
zone: zone3
servers:

  • 172.69.0.90
  • 172.69.0.92
  • 172.69.0.94
    global:
    appname: QL_OB_DW
    root_password: 3@9/_4o6K
    mysql_port: 2881
    rpc_port: 2882
    home_path: /root/QL_OB_DW/oceanbase
    scenario: olap
    datafile_size: 150GB
    log_disk_size: 150GB
    memory_limit: 80GB
    system_memory: 10GB
    devname: eth0
    cluster_id: 1734594073
    proxyro_password: 6Pk0YGglDk
    enable_syslog_wf: false
    max_syslog_file_count: 4
    cpu_count: 30
    obproxy-ce:
    version: 4.3.2.0
    package_hash: fd779e401be448715254165b1a4f7205c4c1bda5
    release: 26.el7
    servers:
  • 172.69.0.90
    global:
    prometheus_listen_port: 2884
    listen_port: 2883
    rpc_listen_port: 2885
    home_path: /root/QL_OB_DW/obproxy
    obproxy_sys_password: I)Kc?=h4=D#E3~R|
    skip_proxy_sys_private_check: true
    enable_strict_kernel_release: false
    enable_cluster_checkout: false
    rs_list: 172.69.0.90:2881;172.69.0.92:2881;172.69.0.94:2881
    observer_sys_password: 6Pk0YGglDk
    cluster_name: QL_OB_DW
    observer_root_password: 3@9/_4o6K
    172.69.0.90:
    proxy_id: 988
    client_session_id_version: 2
    depends:
  • oceanbase-ce

image

带参重启下这个节点的observer,然后发下启动的observer.log

./bin/observer -o "log_disk_size=150G,datafile_size=180G,log_disk_utilization_threshold=95"

observer.7z (9.4 MB)

目前是3个节点都挂了吗?

每次都是先挂俩,然后提示下面这个错误


嗯,挂两个节点第三个节点也会挂的,麻烦使用obd启动下这个集群,观察一段时间,然后将3个节点的observer.log都发下

先提前检查下这三个节点的时钟是否同步,磁盘空间及读写是否正常,
操作系统层也看下message.log,dmesg有没有IO相关的错误

你好 读写怎么检查

可以使用dd ,参考下,注意不要覆盖已有的文件
https://blog.csdn.net/qq3910/article/details/141140116