【 使用环境 】测试环境
【 OB or 其他组件 】 OceanBase_CE
【 使用版本 】OceanBase_CE_V4.2.1.7
【问题描述】
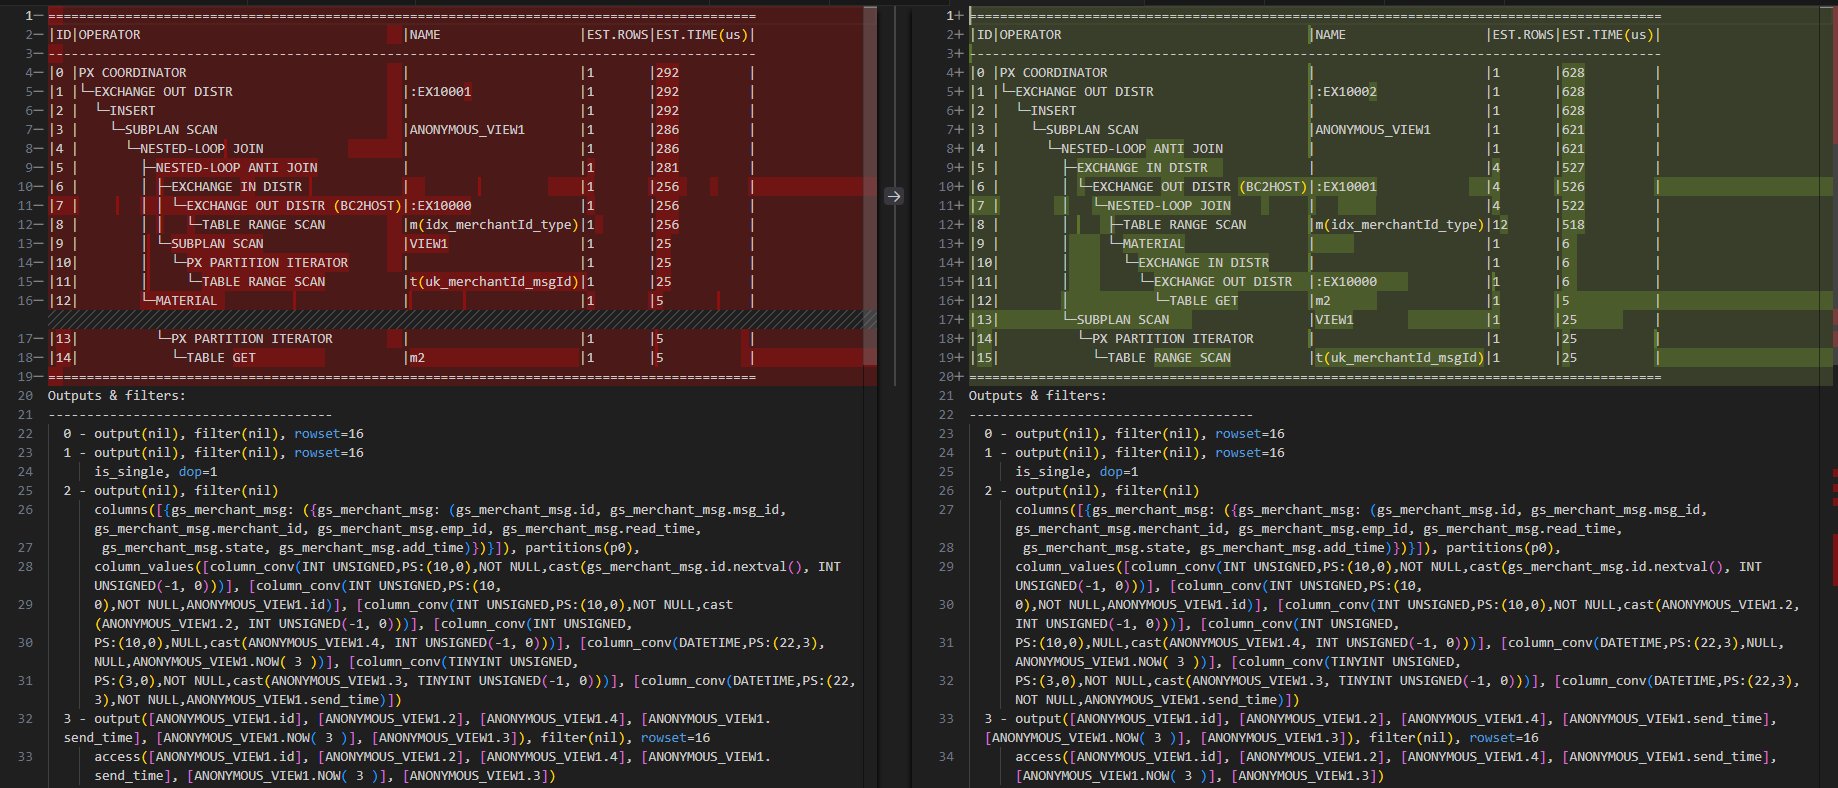
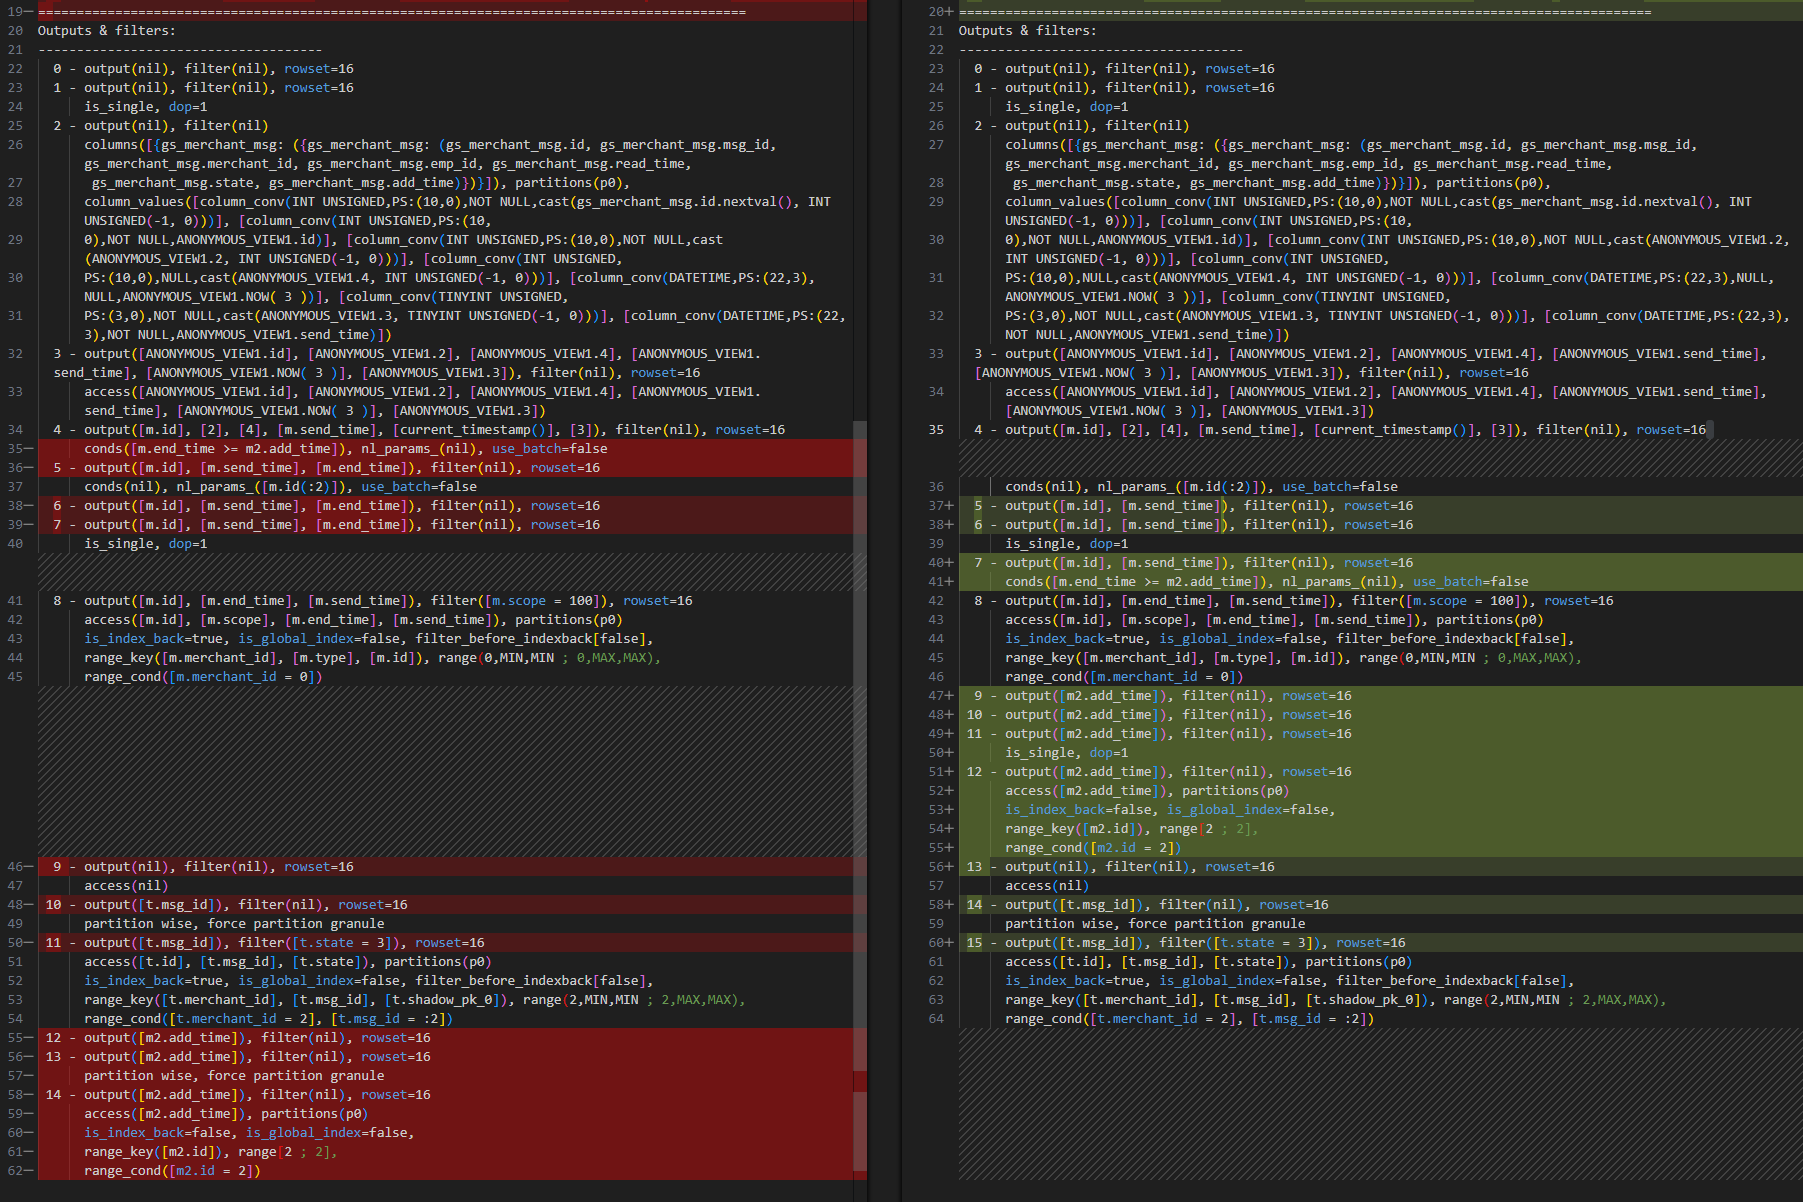
INSERT INTO gs_merchant_msg ( msg_id, merchant_id, emp_id, add_time, read_time, state )
SELECT m.id, 2, 4, m.send_time, NOW( 3 ), 3
FROM gs_msg m
  INNER JOIN gs_merchant m2 ON m2.id = 2
  LEFT JOIN gs_merchant_msg t ON t.merchant_id = 2
  AND t.msg_id = m.id
  AND t.state = 3
WHERE
  m.merchant_id = 0
  AND m.scope = 100
  AND t.id IS NULL
  AND m.end_time >= m2.add_time
应用程序执行上述 SQL,莫名出现意外报错 [ 4016 - Internal Error ],补充说明以下几点:
- 我们有多个环境,OB版本是完全一致的,表结构也是一致的(数据有区别)。
- 在其中一个环境的 OB 执行上述SQL会稳定出现该报错。在其他环境执行同样的SQL,并不会报错。
- 通过应用程序执行,或者通过 Navicat 连接执行,只要是该环境,都会出现该报错。
- 忽略
INSERT INTO,只执行后面的SELECT语句,实际返回的是 空(没有数据)。
【附件及日志】
以下是从日志文件中找到的可能相关的错误日志:
observer.log.20240819134900148:[2024-08-19 13:47:53.125276] WDIAG update_qc_error_code (ob_px_util.h:591) [10304][T1002_L0_G0][T1002][YB42AC1F20D6-00061D78E29DC6D6-0-0] [lt=9][errcode=-4016]
observer.log.20240819134900148:[2024-08-19 13:47:53.125284] WDIAG [SQL.ENG] process_sqc_finish_msg_once (ob_px_scheduler.cpp:410) [10304][T1002_L0_G0][T1002][YB42AC1F20D6-00061D78E29DC6D6-0-0] [lt=7][errcode=-4016] sqc fail, abort qc(pkt={dfo_id:1, sqc_id:0, rc:-4016, das_retry_rc:0, sqc_affected_rows:0}, ret=-4016, sqc_addr="172.31.44.197:2882")
observer.log.20240819134900148:[2024-08-19 13:47:53.125295] WDIAG [SQL.ENG] on_sqc_finish_msg (ob_px_scheduler.cpp:296) [10304][T1002_L0_G0][T1002][YB42AC1F20D6-00061D78E29DC6D6-0-0] [lt=10][errcode=-4016] failed to process_sqc_finish_msg_once
observer.log.20240819134900148:[2024-08-19 13:47:53.125300] WDIAG [SQL.DTL] process (ob_dtl_channel_loop.cpp:209) [10304][T1002_L0_G0][T1002][YB42AC1F20D6-00061D78E29DC6D6-0-0] [lt=4][errcode=-4016] process message in channel fail(header={hlen:16, type:12, nbody:63, checksum:0}, ret=-4016)
observer.log.20240819134900148:[2024-08-19 13:47:53.125316] WDIAG [SQL.DTL] process_base (ob_dtl_channel_loop.cpp:272) [10304][T1002_L0_G0][T1002][YB42AC1F20D6-00061D78E29DC6D6-0-0] [lt=15][errcode=-4016] fail process channel(ret=-4016)
observer.log.20240819134900148:[2024-08-19 13:47:53.125319] WDIAG [SQL.ENG] fetch_rows (ob_px_fifo_coord_op.cpp:212) [10304][T1002_L0_G0][T1002][YB42AC1F20D6-00061D78E29DC6D6-0-0] [lt=3][errcode=-4016] fail process message(ret=-4016)
observer.log.20240819134900148:[2024-08-19 13:47:53.125328] WDIAG [SQL.ENG] fetch_rows (ob_px_fifo_coord_op.cpp:244) [10304][T1002_L0_G0][T1002][YB42AC1F20D6-00061D78E29DC6D6-0-0] [lt=7][errcode=-4016] QC get error code(ret=-4016, ret_terminate=0)
observer.log.20240819134900148:[2024-08-19 13:47:53.125333] WDIAG [SQL.ENG] get_next_batch (ob_operator.cpp:1194) [10304][T1002_L0_G0][T1002][YB42AC1F20D6-00061D78E29DC6D6-0-0] [lt=4][errcode=-4016] get next batch failed(ret=-4016, eval_ctx={batch_idx:0, batch_size:16, max_batch_size:16, frames_:0x7f224f0166a0}, id=0, op_name="PHY_PX_FIFO_COORD")
observer.log.20240819134900148:[2024-08-19 13:47:53.125341] WDIAG [SQL.ENG] get_next_row (ob_operator.cpp:1499) [10304][T1002_L0_G0][T1002][YB42AC1F20D6-00061D78E29DC6D6-0-0] [lt=7][errcode=-4016] get next batch failed(ret=-4016)
observer.log.20240819134900148:[2024-08-19 13:47:53.125346] WDIAG [SQL] inner_get_next_row (ob_result_set.cpp:411) [10304][T1002_L0_G0][T1002][YB42AC1F20D6-00061D78E29DC6D6-0-0] [lt=4][errcode=-4016] get next row from exec result failed(ret=-4016)
observer.log.20240819134900148:[2024-08-19 13:47:53.125350] WDIAG [SQL] drive_dml_query (ob_result_set.cpp:1448) [10304][T1002_L0_G0][T1002][YB42AC1F20D6-00061D78E29DC6D6-0-0] [lt=4][errcode=-4016] do dml query failed(ret=-4016)
observer.log.20240819134900148:[2024-08-19 13:47:53.125354] WDIAG [SQL] open_result (ob_result_set.cpp:214) [10304][T1002_L0_G0][T1002][YB42AC1F20D6-00061D78E29DC6D6-0-0] [lt=4][errcode=-4016] fail to drive dml query(ret=-4016)
observer.log.20240819134900148:[2024-08-19 13:47:53.125358] WDIAG [SQL] open (ob_result_set.cpp:160) [10304][T1002_L0_G0][T1002][YB42AC1F20D6-00061D78E29DC6D6-0-0] [lt=3][errcode=-4016] open result set failed(ret=-4016)
observer.log.20240819134900148:[2024-08-19 13:47:53.125364] WDIAG [SERVER] after_func (ob_query_retry_ctrl.cpp:947) [10304][T1002_L0_G0][T1002][YB42AC1F20D6-00061D78E29DC6D6-0-0] [lt=3][errcode=-4016] [RETRY] check if need retry(v={force_local_retry:false, stmt_retry_times:0, local_retry_times:0, err_:-4016, err_:"OB_ERR_UNEXPECTED", retry_type:0, client_ret:-4016}, need_retry=false, THIS_WORKER.can_retry()=true, v.ctx_.multi_stmt_item_={is_part_of_multi_stmt:false, seq_num:0, sql:"", batched_queries:NULL, is_ps_mode:false, ab_cnt:0})
observer.log.20240819134900148:[2024-08-19 13:47:53.125374] WDIAG [SERVER] response_result (ob_sync_plan_driver.cpp:82) [10304][T1002_L0_G0][T1002][YB42AC1F20D6-00061D78E29DC6D6-0-0] [lt=10][errcode=-4016] result set open failed, check if need retry(ret=-4016, cli_ret=-4016, retry_ctrl_.need_retry()=0)
observer.log.20240819134900148:[2024-08-19 13:47:53.125405] INFO  [DETECT] maintain_deadlock_info_when_end_stmt (ob_trans_deadlock_adapter.cpp:646) [10304][T1002_L0_G0][T1002][YB42AC1F20D6-00061D78E29DC6D6-0-0] [lt=5] try unregister deadlock detecotr cause conflict array is empty(step=9, ret=0, ret="OB_SUCCESS", exec_ctx.get_errcode()=-4016, exec_ctx.get_errcode()="OB_ERR_UNEXPECTED", session={this:0x7f25fd5d01f8, id:3224512736, deser:false, tenant:"myapp", tenant_id:1002, effective_tenant:"myapp", effective_tenant_id:1002, database:"my_db", user:"myapp@%", consistency_level:3, session_state:2, autocommit:false, tx:0x7f2acb2b3ce0}, desc={this:0x7f2acb2b3ce0, tx_id:{txid:1358185025}, state:1, addr:"172.31.32.214:2882", tenant_id:1002, session_id:3224512736, assoc_session_id:3224512736, xid:NULL, xa_mode:"", xa_start_addr:"0.0.0.0:0", access_mode:0, tx_consistency_type:0, isolation:1, snapshot_version:{val:18446744073709551615, v:3}, snapshot_scn:0, active_scn:0, op_sn:2, alloc_ts:1724046472114271, active_ts:-1, commit_ts:-1, finish_ts:-1, timeout_us:86400000000, lock_timeout_us:-1, expire_ts:9223372036854775807, coord_id:{id:-1}, parts:[], exec_info_reap_ts:0, commit_version:{val:18446744073709551615, v:3}, commit_times:0, commit_cb:null, cluster_id:1719287282, cluster_version:17180000519, flags_.SHADOW:false, flags_.INTERRUPTED:false, flags_.BLOCK:false, flags_.REPLICA:false, can_elr:true, cflict_txs:[], abort_cause:0, commit_expire_ts:-1, commit_task_.is_registered():false, ref:2}, is_rollback=true, conflict_txs=[])
observer.log.20240819134900148:[2024-08-19 13:47:53.125435] INFO  [DETECT] maintain_deadlock_info_when_end_stmt (ob_trans_deadlock_adapter.cpp:670) [10304][T1002_L0_G0][T1002][YB42AC1F20D6-00061D78E29DC6D6-0-0] [lt=30] maintain deadlock info(step=9, ret=0, ret="OB_SUCCESS", exec_ctx.get_errcode()=-4016, exec_ctx.get_errcode()="OB_ERR_UNEXPECTED", session={this:0x7f25fd5d01f8, id:3224512736, deser:false, tenant:"myapp", tenant_id:1002, effective_tenant:"myapp", effective_tenant_id:1002, database:"my_db", user:"myapp@%", consistency_level:3, session_state:2, autocommit:false, tx:0x7f2acb2b3ce0}, desc={this:0x7f2acb2b3ce0, tx_id:{txid:1358185025}, state:1, addr:"172.31.32.214:2882", tenant_id:1002, session_id:3224512736, assoc_session_id:3224512736, xid:NULL, xa_mode:"", xa_start_addr:"0.0.0.0:0", access_mode:0, tx_consistency_type:0, isolation:1, snapshot_version:{val:18446744073709551615, v:3}, snapshot_scn:0, active_scn:0, op_sn:2, alloc_ts:1724046472114271, active_ts:-1, commit_ts:-1, finish_ts:-1, timeout_us:86400000000, lock_timeout_us:-1, expire_ts:9223372036854775807, coord_id:{id:-1}, parts:[], exec_info_reap_ts:0, commit_version:{val:18446744073709551615, v:3}, commit_times:0, commit_cb:null, cluster_id:1719287282, cluster_version:17180000519, flags_.SHADOW:false, flags_.INTERRUPTED:false, flags_.BLOCK:false, flags_.REPLICA:false, can_elr:true, cflict_txs:[], abort_cause:0, commit_expire_ts:-1, commit_task_.is_registered():false, ref:2}, is_rollback=true, conflict_txs=[])
observer.log.20240819134900148:[2024-08-19 13:47:53.125450] INFO  [SQL.EXE] end_stmt (ob_sql_trans_control.cpp:1129) [10304][T1002_L0_G0][T1002][YB42AC1F20D6-00061D78E29DC6D6-0-0] [lt=12] end stmt(ret=0, plain_select=false, stmt_type=2, savepoint=1724046473122673, tx_desc={this:0x7f2acb2b3ce0, tx_id:{txid:1358185025}, state:1, addr:"172.31.32.214:2882", tenant_id:1002, session_id:3224512736, assoc_session_id:3224512736, xid:NULL, xa_mode:"", xa_start_addr:"0.0.0.0:0", access_mode:0, tx_consistency_type:0, isolation:1, snapshot_version:{val:18446744073709551615, v:3}, snapshot_scn:0, active_scn:0, op_sn:3, alloc_ts:1724046472114271, active_ts:-1, commit_ts:-1, finish_ts:-1, timeout_us:86400000000, lock_timeout_us:-1, expire_ts:9223372036854775807, coord_id:{id:-1}, parts:[], exec_info_reap_ts:0, commit_version:{val:18446744073709551615, v:3}, commit_times:0, commit_cb:null, cluster_id:1719287282, cluster_version:17180000519, flags_.SHADOW:false, flags_.INTERRUPTED:false, flags_.BLOCK:false, flags_.REPLICA:false, can_elr:true, cflict_txs:[], abort_cause:0, commit_expire_ts:-1, commit_task_.is_registered():false, ref:2}, trans_result={incomplete:false, parts:[], touched_ls_list:[], cflict_txs:[]}, rollback=true, session={this:0x7f25fd5d01f8, id:3224512736, deser:false, tenant:"myapp", tenant_id:1002, effective_tenant:"myapp", effective_tenant_id:1002, database:"my_db", user:"myapp@%", consistency_level:3, session_state:2, autocommit:false, tx:0x7f2acb2b3ce0}, exec_ctx.get_errcode()=-4016)
observer.log.20240819134900148:[2024-08-19 13:47:53.125473] WDIAG [SERVER] response_result (ob_sync_plan_driver.cpp:92) [10304][T1002_L0_G0][T1002][YB42AC1F20D6-00061D78E29DC6D6-0-0] [lt=22][errcode=-4016] close result set fail(cret=-4016)
observer.log.20240819134900148:[2024-08-19 13:47:53.125482] INFO  [SERVER] send_error_packet (obmp_packet_sender.cpp:319) [10304][T1002_L0_G0][T1002][YB42AC1F20D6-00061D78E29DC6D6-0-0] [lt=4] sending error packet(ob_error=-4016, client error=-4016, extra_err_info=NULL, lbt()="0x1203501c 0x9db8660 0x9d65e29 0x4c573b5 0x9ddb062 0x9ddc2f2 0x9de342f 0x9de69cc 0x4c300c7 0x4c296a0 0x9a8d0d4 0x123077c3 0x7f2b65f6844b 0x7f2b65ca352f")
observer.log.20240819134900148:[2024-08-19 13:47:53.125504] INFO  [SERVER] send_error_packet (obmp_packet_sender.cpp:502) [10304][T1002_L0_G0][T1002][YB42AC1F20D6-00061D78E29DC6D6-0-0] [lt=4] dump txn free route audit_record(value=1048581, session->get_sessid()=3224512736, session->get_proxy_sessid()=12402670931653377457)
observer.log.20240819134900148:[2024-08-19 13:47:53.125508] WDIAG [SERVER] execute_response (obmp_stmt_execute.cpp:1175) [10304][T1002_L0_G0][T1002][YB42AC1F20D6-00061D78E29DC6D6-0-0] [lt=3][errcode=-4016] execute query fail(ret=-4016, timeout_timestamp=1724046533123356)
observer.log.20240819134900148:[2024-08-19 13:47:53.125537] WDIAG [SERVER] process_execute_stmt (obmp_stmt_execute.cpp:1741) [10304][T1002_L0_G0][T1002][YB42AC1F20D6-00061D78E29DC6D6-0-0] [lt=5][errcode=-4016] fail to do process(ret=-4016, ctx_.cur_sql_=INSERT INTO gs_merchant_msg ( msg_id, merchant_id, emp_id, add_time, read_time, state)
observer.log.20240819134900148:[2024-08-19 13:47:53.125545] WDIAG [SERVER] process (obmp_stmt_execute.cpp:1898) [10304][T1002_L0_G0][T1002][YB42AC1F20D6-00061D78E29DC6D6-0-0] [lt=6][errcode=-4016] fail execute sql(sql_id="1D338D993E93BBB49A64B2DBEA4AEAAB", stmt_id=15, ret=-4016)