大家好,刚刚才安装的 OceanBase 4.2.2 最新社区版,只是创建了一个业务租户,分配了资源池,还没有导入任何数据。
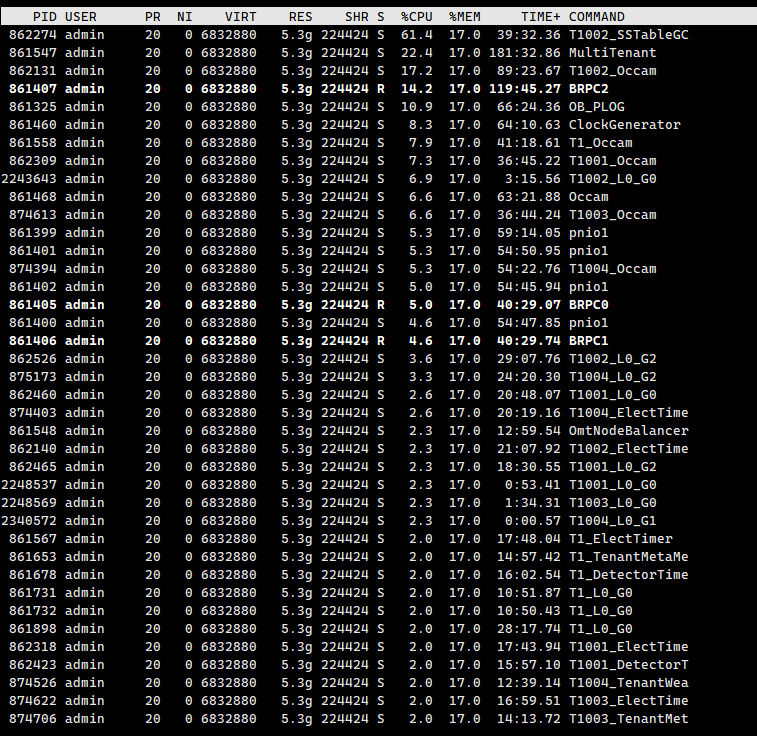
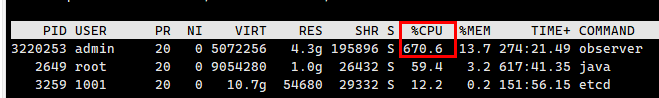
但是,发现每个节点的CPU占用都非常高,看起来有点吓人,请问这种情况正常吗 ?
大家好,刚刚才安装的 OceanBase 4.2.2 最新社区版,只是创建了一个业务租户,分配了资源池,还没有导入任何数据。
但是,发现每个节点的CPU占用都非常高,看起来有点吓人,请问这种情况正常吗 ?
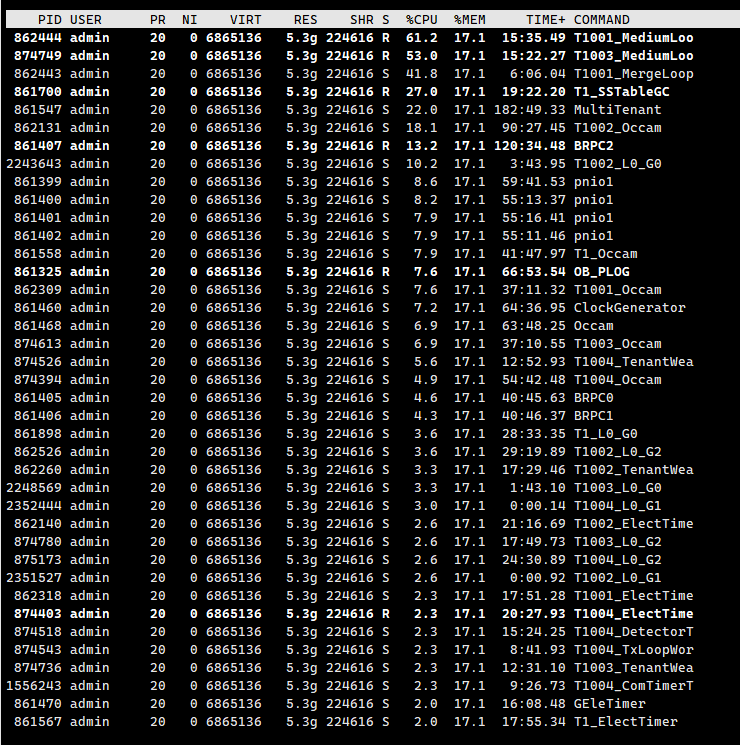
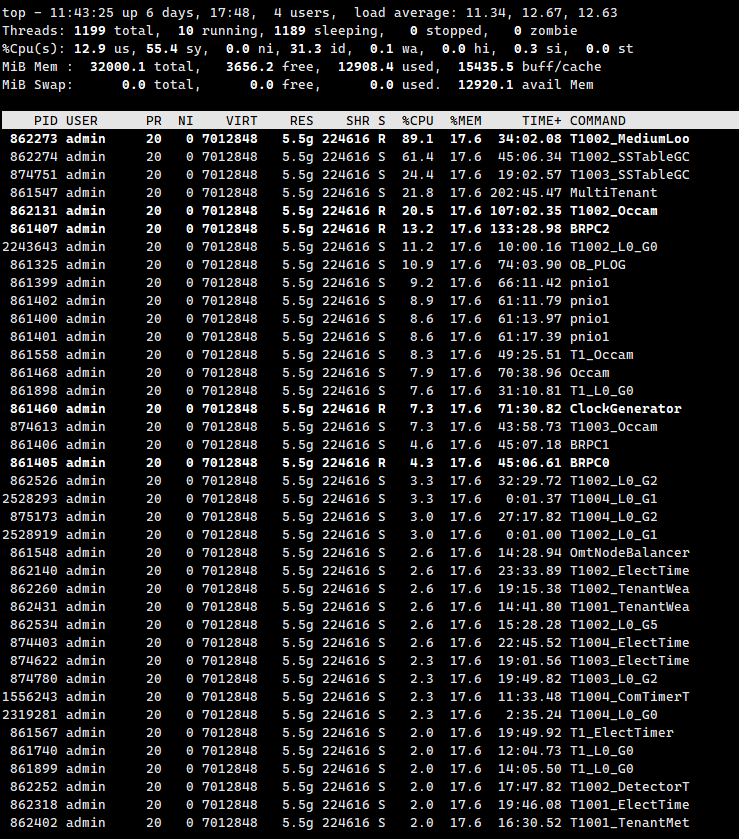
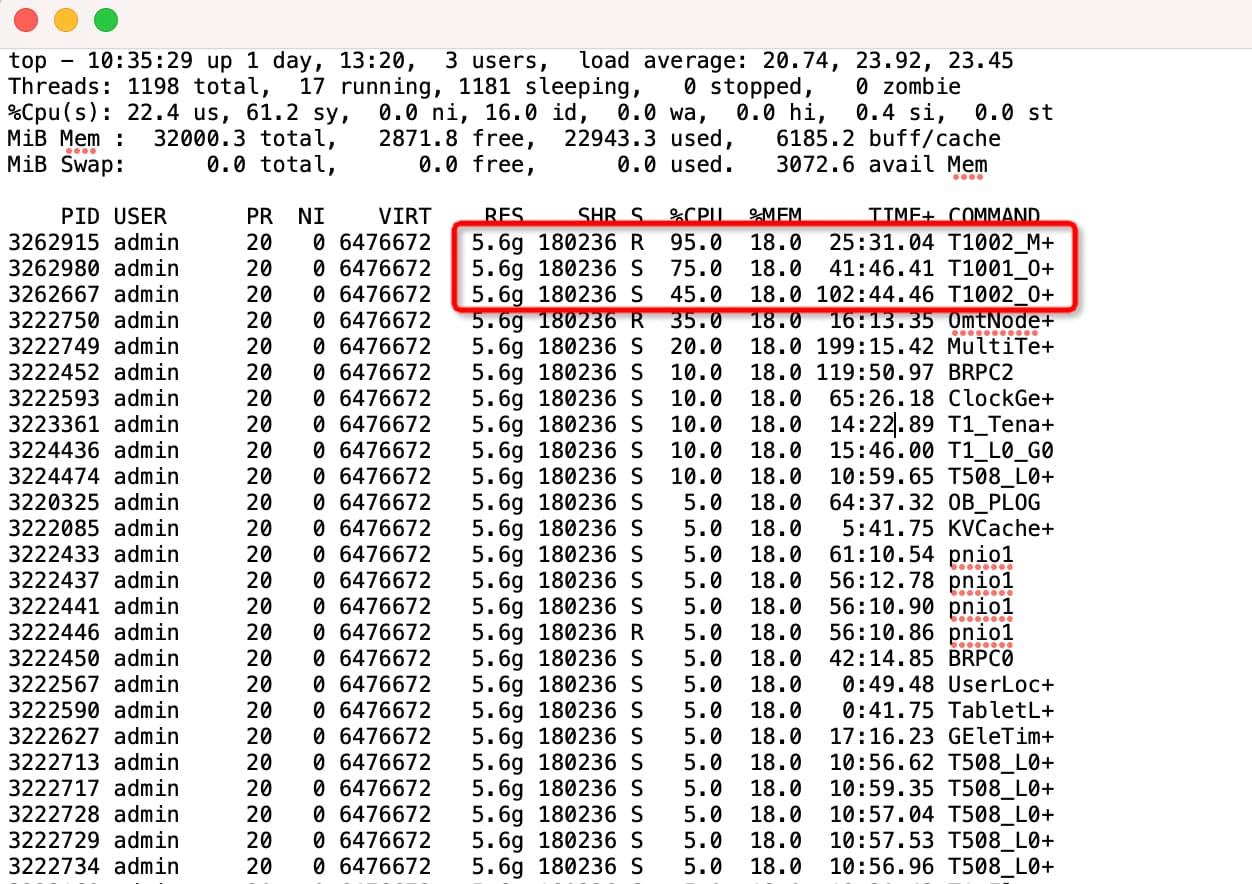
看一下线程和每个线程的详细信息
想捞点诊断信息需要的数据,建议通过obdiag来获取,
obdiag gather scene run --scene=observer.cpu_high
https://www.oceanbase.com/docs/common-obdiag-cn-1000000000691957
SELECT * FROM oceanbase.GV$OB_SQL_AUDIT
sql_audit 是查询这个视图吗 ?这里面的数据非常多诶,有21W+条。
[admin@test02 oceanbase-diagnostic-tool]$ ./obdiag gather scene run --scene=observer.cpu_high
gather_scenes_run start ...
gather from_time: 2024-04-24 09:47:06, to_time: 2024-04-24 10:18:06
[ERROR] Failed to find yaml task path: /home/admin/.obdiag/gather/tasks/
gather obstack start
[ERROR] ssh @127.0.0.1: failed, Please check the ~/.obdiag/config.yml

Gather Ob stack Summary:
+-----------+---------------------------------------------+--------+--------+------------+
| Node      | Status                                      | Size   | Time   | PackPath   |
+===========+=============================================+========+========+============+
| 127.0.0.1 | Error:Please check the ~/.obdiag/config.yml | 0.000B | 0 s    |            |
+-----------+---------------------------------------------+--------+--------+------------+
gather obstack end
gather perf start
[ERROR] ssh @127.0.0.1: failed, Please check the ~/.obdiag/config.yml

Gather Perf Summary:
+-----------+-----------+--------+--------+------------+
| Node      | Status    | Size   | Time   | PackPath   |
+===========+===========+========+========+============+
| 127.0.0.1 | Completed | 0.000B | 0 s    |            |
+-----------+-----------+--------+--------+------------+
gather perf end
gather current_clocksource start
[ERROR] SshHandler init fail. Please check the node conf. Exception : Authentication failed. .
gather observer log start
gather log from_time: 2024-04-24 09:47:06, to_time: 2024-04-24 10:18:06
[ERROR] ssh @127.0.0.1: failed, Please check the ~/.obdiag/config.yml

Gather Ob Log Summary:
+-----------+---------------------------------------------+--------+--------+------------+
| Node      | Status                                      | Size   | Time   | PackPath   |
+===========+=============================================+========+========+============+
| 127.0.0.1 | Error:Please check the ~/.obdiag/config.yml | 0.000B | 0 s    |            |
+-----------+---------------------------------------------+--------+--------+------------+
gather observer log end

Gather scene results stored in this directory: /home/admin/.obd/repository/oceanbase-diagnostic-tool/2.0.0/19a1ee005e31290bbaa6eca58cdbba8dd7e72c42/oceanbase-diagnostic-tool/gather_pack_20240424101706
我捞了一下,但是执行貌似报错了。生成的文件里面貌似没什么东西,和控制台输出的内容没啥区别。
需要配置一下被诊断集群,obdiag config -h <db_host> -u <sys_user> [-p password] [-P port]
https://www.oceanbase.com/docs/common-obdiag-cn-1000000000691942
谢谢您的热心帮助!
[admin@test02 oceanbase-diagnostic-tool]$ ./obdiag gather scene run --scene=observer.cpu_high
gather_scenes_run start ...
gather from_time: 2024-04-24 10:05:02, to_time: 2024-04-24 10:36:02
[ERROR] Failed to find yaml task path: /home/admin/.obdiag/gather/tasks/
gather obstack start
[ERROR] Gather obstack info on the host 10.0.0.2 observer pid 3220253
[ERROR] Gather obstack info on the host 10.0.0.3 observer pid 861317

Gather Ob stack Summary:
+----------+--------------------------------------+--------+--------+------------+
| Node     | Status                               | Size   | Time   | PackPath   |
+==========+======================================+========+========+============+
| 10.0.0.2 | Error:gather failed, folder is empty | 0.000B | 13 s   |            |
+----------+--------------------------------------+--------+--------+------------+
| 10.0.0.3 | Error:gather failed, folder is empty | 0.000B | 12 s   |            |
+----------+--------------------------------------+--------+--------+------------+
gather obstack end
gather perf start
Download 10.0.0.2:/tmp/perf_10.0.0.2_20240424103528.zip
Downloading [====================] 100.0% [11.54 KB ]
Download 10.0.0.3:/tmp/perf_10.0.0.3_20240424103529.zip
Downloading [====================] 100.0% [11.27 KB ]

Gather Perf Summary:
+----------+-----------+---------+--------+--------------------------------------------------------------------------------------------------------------------------------------------------------------------------------------------+
| Node     | Status    | Size    | Time   | PackPath                                                                                                                                                                                   |
+==========+===========+=========+========+============================================================================================================================================================================================+
| 10.0.0.2 | Completed | 11.537K | 1 s    | /home/admin/.obd/repository/oceanbase-diagnostic-tool/2.0.0/19a1ee005e31290bbaa6eca58cdbba8dd7e72c42/oceanbase-diagnostic-tool/gather_pack_20240424103502/perf_10.0.0.2_20240424103528.zip |
+----------+-----------+---------+--------+--------------------------------------------------------------------------------------------------------------------------------------------------------------------------------------------+
| 10.0.0.3 | Completed | 11.270K | 1 s    | /home/admin/.obd/repository/oceanbase-diagnostic-tool/2.0.0/19a1ee005e31290bbaa6eca58cdbba8dd7e72c42/oceanbase-diagnostic-tool/gather_pack_20240424103502/perf_10.0.0.3_20240424103529.zip |
+----------+-----------+---------+--------+--------------------------------------------------------------------------------------------------------------------------------------------------------------------------------------------+
gather perf end
gather current_clocksource start
gather current_clocksource end
gather observer log start
gather log from_time: 2024-04-24 10:05:31, to_time: 2024-04-24 10:36:31

ZipFileInfo:
+----------+-----------+
| Node     | LogSize   |
+==========+===========+
| 10.0.0.2 | 120.277M  |
+----------+-----------+
Download 10.0.0.2:/tmp/ob_log_10.0.0.2_20240424100531_20240424103631.zip
Downloading [====================] 100.0% [120.28 MB ]

ZipFileInfo:
+----------+-----------+
| Node     | LogSize   |
+==========+===========+
| 10.0.0.3 | 100.148M  |
+----------+-----------+
Download 10.0.0.3:/tmp/ob_log_10.0.0.3_20240424100531_20240424103631.zip
Downloading [====================] 100.0% [100.15 MB ]

Gather Ob Log Summary:
+----------+-----------+----------+--------+-------------------------------------------------------------------------------------------------------------------------------------------------------------------------------------------------------------+
| Node     | Status    | Size     | Time   | PackPath                                                                                                                                                                                                    |
+==========+===========+==========+========+=============================================================================================================================================================================================================+
| 10.0.0.2 | Completed | 120.277M | 37 s   | /home/admin/.obd/repository/oceanbase-diagnostic-tool/2.0.0/19a1ee005e31290bbaa6eca58cdbba8dd7e72c42/oceanbase-diagnostic-tool/gather_pack_20240424103502/ob_log_10.0.0.2_20240424100531_20240424103631.zip |
+----------+-----------+----------+--------+-------------------------------------------------------------------------------------------------------------------------------------------------------------------------------------------------------------+
| 10.0.0.3 | Completed | 100.148M | 28 s   | /home/admin/.obd/repository/oceanbase-diagnostic-tool/2.0.0/19a1ee005e31290bbaa6eca58cdbba8dd7e72c42/oceanbase-diagnostic-tool/gather_pack_20240424103502/ob_log_10.0.0.3_20240424100531_20240424103631.zip |
+----------+-----------+----------+--------+-------------------------------------------------------------------------------------------------------------------------------------------------------------------------------------------------------------+
gather observer log end

Gather scene results stored in this directory: /home/admin/.obd/repository/oceanbase-diagnostic-tool/2.0.0/19a1ee005e31290bbaa6eca58cdbba8dd7e72c42/oceanbase-diagnostic-tool/gather_pack_20240424103502
执行了一下,貌似日志文件有点大,我先上传2个小一点的。
perf_10.0.0.2_20240424103528.zip (11.5 KB)
perf_10.0.0.3_20240424103529.zip (11.3 KB)
ob_log_10.0.0.3_20240424103631.zip (9.4 MB)
上传文件最大只允许 10MB,因此这里只提供其中一个节点的日志,并精简了部分日志内容。
仅保留了其中一段时间的连续日志内容。
非常感谢 各位大佬的回复!
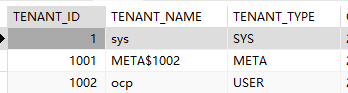
这两个租户,应该都属于系统自带的 ocp 租户( 一个用户租户,一个 Meta 租户)。
ocp 租户的配置,我们没有做任何调整。
而且我们采用的是最小化占用方式进行部署的,ocp 租户的 CPU 和 内存 分配默认是 1C 2GB /节点,按道理也不应该飙升到 500~700%的占用率吧 ?
有几点说明:
查询 租户 1002( ocp租户,1C 2GB/节点)
SELECT
	sql_id,
	query_sql,
	sum( elapsed_time - queue_time ) sum_t,
	count(*) cnt,
	avg( get_plan_time ),
	avg( execute_time )
FROM
	oceanbase.gv$ob_sql_audit
WHERE
	tenant_id = 1002
	AND request_time > ( time_to_usec ( now()) - 10000000 )
	AND request_time < time_to_usec ( now() )
GROUP BY
	sql_id
ORDER BY
	sum_t DESC
	LIMIT 10;
0DCDB999AC02EFF4DD0679F88C56167C	set autocommit = 0	39837	54	232.3519	427.1481
CE24605B761C41943C6BA08A35ADE81F	set autocommit = 1	37073	54	207.4074	403.2593
96F6ACF4C648E78A9B49634B9EC60359	select subtaskins0_.`id` as col_0_0_ from `subtask_instance` subtaskins0_ where subtaskins0_.`state`='RUNNING' and subtaskins0_.`update_time`>='2024-04-22 11:50:47.025'	22260	30	120.3333	502.4000
8FF5FA6E8A815ECBE5239FE8DBDAF781	select taskdefini0_.`id` as id1_14_, taskdefini0_.`arguments` as argument2_14_, taskdefini0_.`comments` as comments3_14_, taskdefini0_.`create_time` as create_t4_14_, taskdefini0_.`creator_id` as creator_5_14_, taskdefini0_.`enabled` as enabled6_14_, taskdefini0_.`last_run_time` as last_run7_14_, taskdefini0_.`name` as name8_14_, taskdefini0_.`next_run_time` as next_run9_14_, taskdefini0_.`schedule_duration_unit` as schedul10_14_, taskdefini0_.`schedule_end_time` as schedul11_14_, taskdefini0_.`schedule_rule` as schedul12_14_, taskdefini0_.`schedule_start_time` as schedul13_14_, taskdefini0_.`schedule_type` as schedul14_14_, taskdefini0_.`template_name` as templat15_14_, taskdefini0_.`update_time` as update_16_14_ from `task_definition` taskdefini0_ where taskdefini0_.`schedule_type`='ONCE' and taskdefini0_.`enabled`=1	11384	20	126.9500	369.3500
58A0629A503BE94DCF21D4F7DBB1A03E	select taskinstan0_.`id` as col_0_0_ from `task_instance` taskinstan0_ where taskinstan0_.`state`='RUNNING'	9269	10	140.3000	620.6000
23F89A4B19B99E0A22B56E3E89E5BBD3	select subtaskins0_.`id` as col_0_0_ from `subtask_instance` subtaskins0_ where subtaskins0_.`state`='READY'	7828	10	109.3000	581.1000
95C0C3694DDE0D604FC69C573DF5E047	select exporterad0_.`id` as id1_3_, exporterad0_.`create_time` as create_t2_3_, exporterad0_.`exporter_url` as exporter3_3_, exporterad0_.`status` as status4_3_, exporterad0_.`update_time` as update_t5_3_ from `metric_exporter_address` exporterad0_ where exporterad0_.`status`='ONLINE'	6131	10	136.8000	277.4000
80ED31270AB4357A73A1DB4600E86277	update `ocp_instance` set `heartbeat_time`='2024-04-24 11:50:51.595', `ip`='10.0.0.3', `port`=8180 where `id`=1	3352	2	123.5000	1449.0000
443C2918E15A188E49F13DAD8AC963CA	select ocpinstanc0_.`id` as id1_10_, ocpinstanc0_.`create_time` as create_t2_10_, ocpinstanc0_.`heartbeat_time` as heartbea3_10_, ocpinstanc0_.`ip` as ip4_10_, ocpinstanc0_.`port` as port5_10_, ocpinstanc0_.`update_time` as update_t6_10_ from `ocp_instance` ocpinstanc0_ where ocpinstanc0_.`ip`='10.0.0.3' and ocpinstanc0_.`port`=8180	1809	2	213.5000	612.0000
4CB48DA76064822F375AF0BACC7FC816	select taskinstan0_.`id` as id1_15_, taskinstan0_.`context` as context2_15_, taskinstan0_.`creator` as creator4_15_, taskinstan0_.`end_time` as end_time5_15_, taskinstan0_.`executor` as executor6_15_, taskinstan0_.`name` as name7_15_, taskinstan0_.`ob_tenant_id` as ob_tenan8_15_, taskinstan0_.`operation` as operatio9_15_, taskinstan0_.`start_time` as start_t10_15_, taskinstan0_.`state` as state11_15_, taskinstan0_.`task_definition_id` as task_de12_15_, taskinstan0_.`trace_id` as trace_i13_15_, taskinstan0_.`type` as type14_15_ from `task_instance` taskinstan0_ where (taskinstan0_.`state` in ('RUNNING')) and taskinstan0_.`type`='MANUAL' order by taskinstan0_.`id` desc limit 2000	1669	2	164.5000	539.0000
查询租户 1004 (业务租户,MIN 2~ MAX 8C + 12GB / 节点)
SELECT
	sql_id,
	query_sql,
	sum( elapsed_time - queue_time ) sum_t,
	count(*) cnt,
	avg( get_plan_time ),
	avg( execute_time )
FROM
	oceanbase.gv$ob_sql_audit
WHERE
	tenant_id = 1004
	AND request_time > ( time_to_usec ( now()) - 10000000 )
	AND request_time < time_to_usec ( now() )
GROUP BY
	sql_id
ORDER BY
	sum_t DESC
	LIMIT 10;
CE24605B761C41943C6BA08A35ADE81F	set autocommit = 1	15062	24	191.1250	366.0833
0DCDB999AC02EFF4DD0679F88C56167C	set autocommit = 0	12025	18	212.2222	381.7778
1589AE1DAD426F6B728EBA39B3316CA7	SELECT  id,project_id,step_order,step_name,step_desc,step_status,step_progress,remaining_seconds,step_info,is_show,extra_info,start_time,finish_time,gmt_create,retry_count,gmt_modified,interactive  FROM oms_step

 WHERE step_name = 'INDEX_TRANSFER' AND step_status = 'RUNNING' ORDER BY id ASC	9793	20	116.0500	284.8000
1D0BA376E273B9D622641124D8C59264	COMMIT	8958	17	161.0000	293.2941
5166BEAA2EE5D37109DCA50BD3E1AE95	UPDATE shedlock SET lock_until = '2024-04-24 11:52:21.271' WHERE name = 'omsAlarmSend'	6851	11	116.2727	416.2727
464EAF546103E8BB2BD129A1B7A4D83C	insert into heatbeat_sequence(id,gmt_created,gmt_modified )
		values (null,now(),now())	4950	1	255.0000	4635.0000
FBD5E474371E49B5A64B643292FF89FF	UPDATE shedlock SET lock_until = '2024-04-24 11:56:24.44', locked_at = '2024-04-24 11:51:24.443', locked_by = 'test02' WHERE name = 'cloudReleasePlan' AND lock_until <= '2024-04-24 11:51:24.443'	4345	7	125.5714	415.4286
D76E56E3212C8C8C32A6C121AABDECD1	SELECT  id,cfg_name,cfg_value,cfg_type,cfg_status,cfg_desc,gmt_create,gmt_modified  FROM oms_normal_config

 WHERE cfg_name = 'ha.config'	3044	3	129.3333	711.6667
5597EAE1A24B2234E36E41AC54209C74	insert into heart_beat (id ,task_type
		,task_name ,task_id ,host_ip ,version, gmt_created ,gmt_modified )
		values

		(3000904,'supervisor','supervisor', null,'10.0.0.3',null,now(),now())

		ON DUPLICATE KEY UPDATE
		version = VALUES(version),
		gmt_modified= now()	2953	1	238.0000	2570.0000
75F3C45D82FAE81D060658AF6AD9C1D9	update host_status set gmt_modified=now(),host_usage_info='{"containerStatus":{"containerCpuCount":12,"containerCpuUsedPercent":0.013626255,"containerDataDiskSizeInGB":0,"containerDataDiskUsedPercent":0.0,"containerDiskSizeInGB":1023.5,"containerDiskUsedPercent":0.14837125,"containerMemSizeInGB":31.25008,"containerMemUsedPercent":0.1756735,"containerNetworkRXInKB":0.0,"containerNetworkWXInKB":0.0,"containerSysDiskSizeInGB":0,"containerSysDiskUsedPercent":0.0},"cpuCount":12,"cpuUsedPercent":0.013626255,"diskSizeInGB":1023.5,"diskUsedPercent":0.14837125,"imageVersion":"","load1":13.61,"load5":11.87,"memSizeInGB":31.25008,"memUsedPercent":0.1756735,"moduleVersionMap":{"full_trans":"oboms-connector-v2-ce-3.0.25-20240123162244.noarch","store":"oboms-xlog-store-ce-5.7.6-20240125111205.alios7.x86_64","checker":"oboms-verifier-ce-2.0.6-20240122162757.noarch","incr_trans":"oboms-connector-v2-ce-3.0.25-20240123162244.noarch"},"supervisorVersion":"oboms-supervisor-ce-2.1.8-20231230193408.noarch"}' where ip='10.0.0.3'	1950	1	150.0000	1737.0000
1001、1003 租户也查询过,返回为空。
看SQL查询结果的话,1002租户都是些ocp的后台任务线程的查询语句;
1004业务租户看起来是有业务数据的?
就是新建的业务租户,打算用于项目测试的,暂时还没有数据。
该业务业务租户在每个节点分配的资源都是 MIN_CPU=2, MAX_CPU=8, 内存=12GB。
-- 创建 资源规格
CREATE RESOURCE UNIT c8
    MEMORY_SIZE = '12G',
    MAX_CPU = 8,
    MIN_CPU = 2;


-- 创建 资源池
CREATE RESOURCE POOL c8p
    UNIT = 'c8',
    UNIT_NUM = 1,
    ZONE_LIST = ('zone1', 'zone2');

-- 创建租户
CREATE TENANT IF NOT EXISTS 业务租户1004的名称
		PRIMARY_ZONE='RANDOM',
		RESOURCE_POOL_LIST=('c8p')
		set OB_TCP_INVITED_NODES='%';
这是执行的 SQL 语句。
还没有哦,昨天晚上安装好之后,还没有导入数据,就发现 CPU 负载过高了。
到现在,CPU 负载也一直没下来过。
我们今天是有规划,打算用 OMS 迁移少量数据过来,观察一下 OMS 的使用与兼容性,为后续生产环境迁移数据做准备。