

【 使用环境 】测试环境
【 OB or 其他组件 】OB
【 使用版本 】
【问题描述】清晰明确描述问题
【复现路径】问题出现前后相关操作
【问题现象及影响】
有没有办法看到执行计划每个部分的执行时间,现在explain只能看到每个算子的预估rows和time,没有真实的时间。Oracle可以看到,PG,tidb有部分支持explain analyze也可以查到。OB似乎explain只能看到估计的代价信息,有没有什么方法可以分析执行计划的每个算子的执行时间呢?
目前直接explain计划还是逻辑计划,并不是真实执行sql后的信息,4.x版本可以仍sql monitor来关测
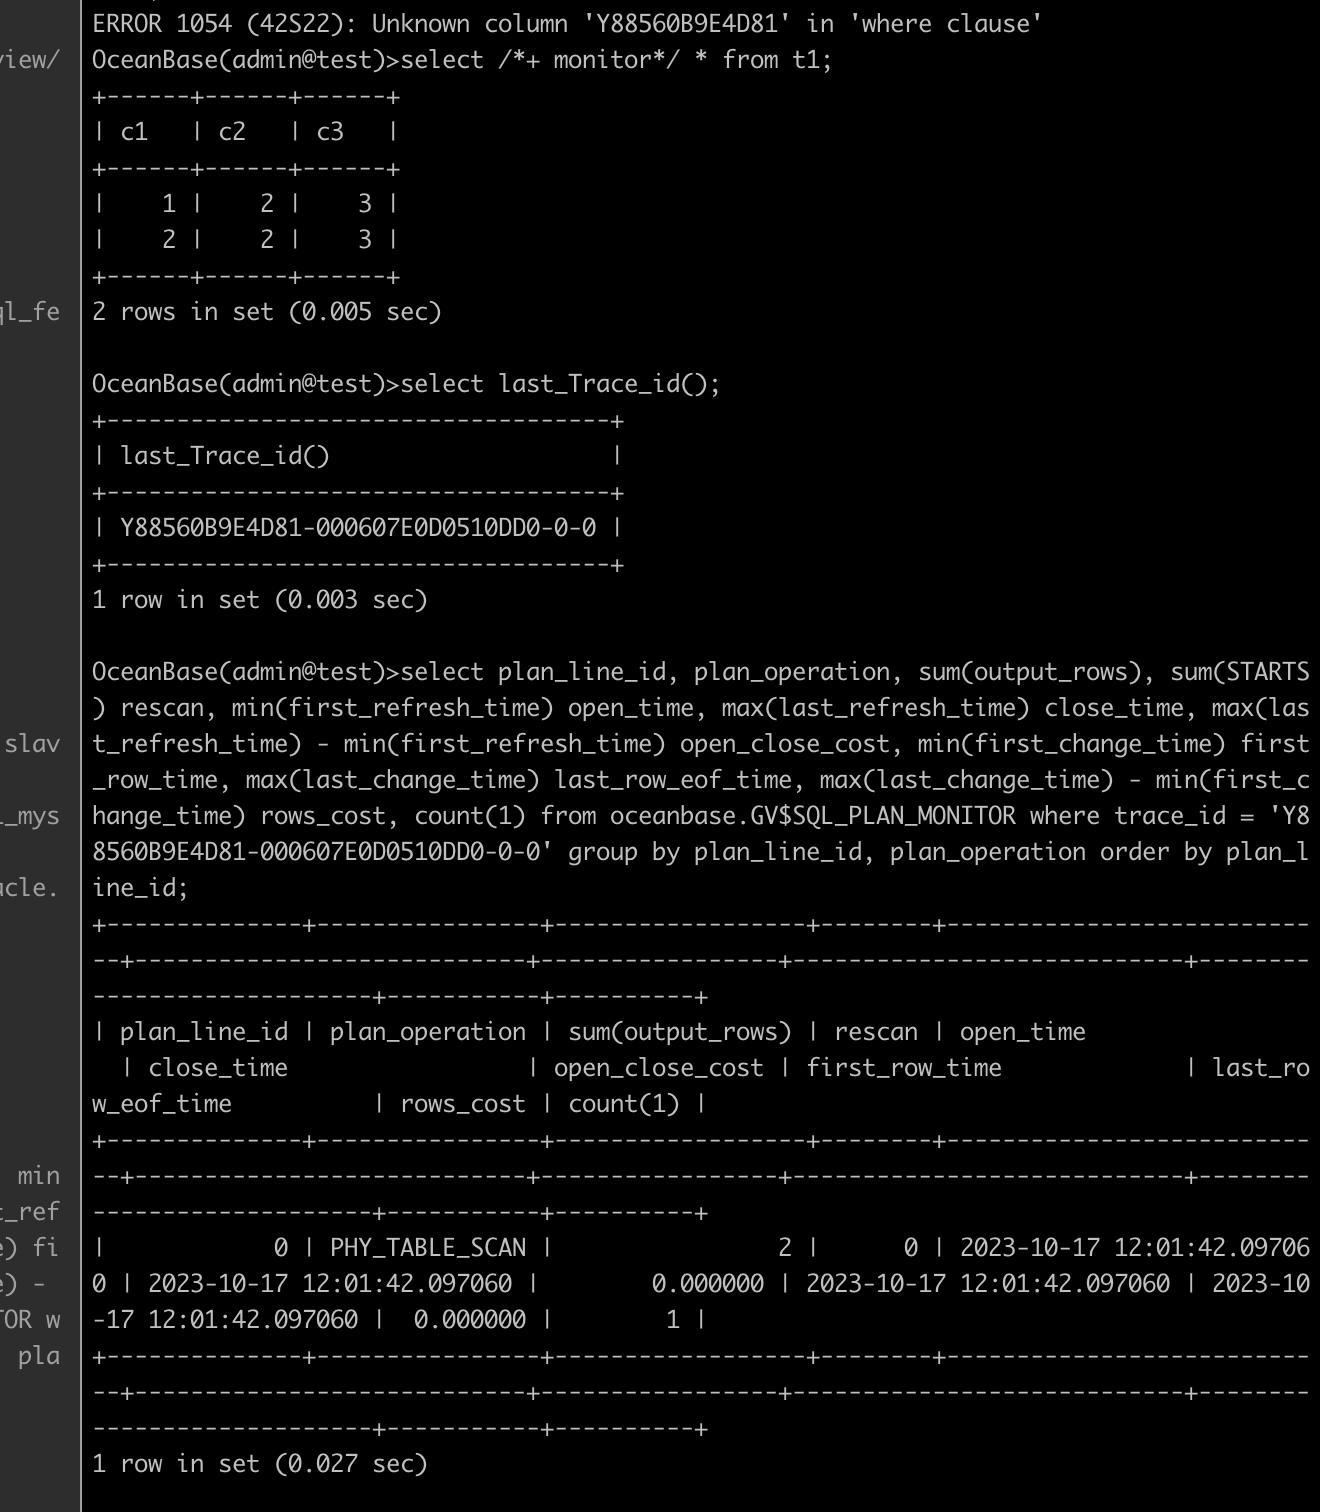
执行完query(加上hint
/+monitor/)
可以执行完以后select last_trace_id()获取trace_id, 然后执行
select plan_line_id, plan_operation, sum(output_rows), sum(STARTS) rescan, min(first_refresh_time) open_time, max(last_refresh_time) close_time, max(last_refresh_time) - min(first_refresh_time) open_close_cost, min(first_change_time) first_row_time, max(last_change_time) last_row_eof_time, max(last_change_time) - min(first_change_time) rows_cost, count(1) from oceanbase.GV$SQL_PLAN_MONITOR where trace_id = ‘Yxxx’ group by plan_line_id, plan_operation order by plan_line_id;
1 个赞
这种太不友好了,应该出一个 explain 看逻辑计划
explain analyze 看真实执行的sql
1 个赞
题主,去提个需求吧
社区版本支持了plan monitor没有。。我直接从GV$SQL_PLAN_MONITOR查不到东西,还是说要用sys租户才可以?
加hint monitor 或者 parallel(xxx) 就有了
这种方式,有些复杂 ![]()
主要格式也没对齐,不好看啊。。
oracle的东西只有企业版才能用
确实估计用的也是sqlplus的客户端
我的数据库是企业版323,请问我的真实物理计划算子有25个,但是monitor中只有23个呢