【 使用环境 】生产环境 or 测试环境
四台服务器,一台用来部署三台做服务
【 OB or 其他组件 】
【 使用版本 】
4.2
【问题描述】清晰明确描述问题
obd test mysqltest --test-dir ./mysql_test/test_suite/alter/t --result-dir ./mysql_test/test_suite/alter/r --test-set alter_log_archive_option --auto-retry
执行这个命令后报错
[root@oceanbase-173-241 ~]# obd test mysqltest test --test-dir ./mysql_test/test_suite/alter/t --result-dir ./mysql_test/teGet local repositories and plugins ok
Open ssh connection ok
Cluster status check ok
Connect obproxy(10.118.174.132:2883) ok
[ RUN ]Running case: alter_log_archive_option ( 1 / 1 ) x
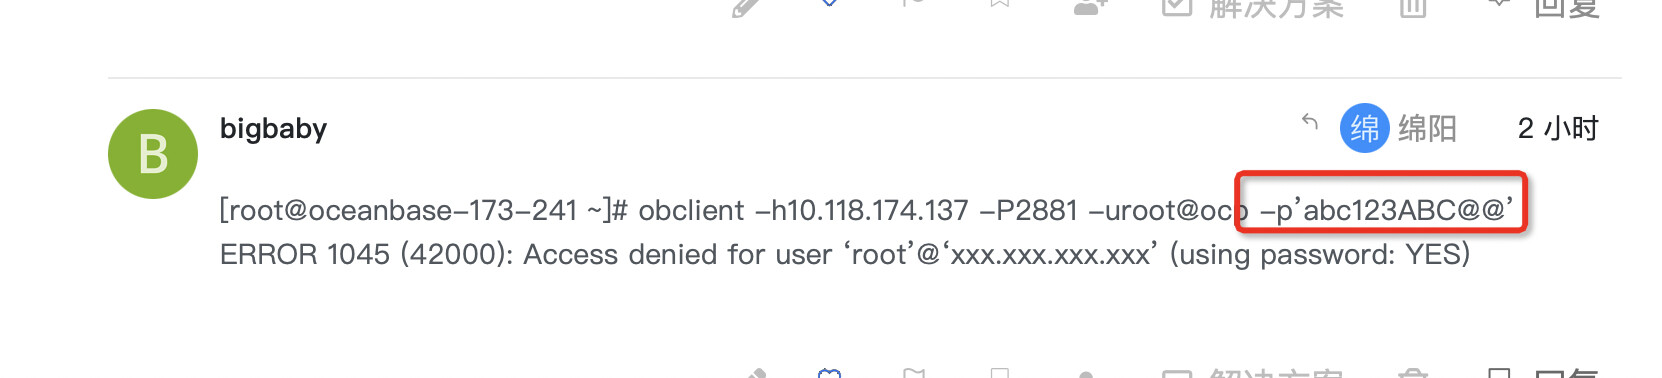
[ERROR] engine failed, exit code 1. error msg: ERROR 1045 (42000): Access denied for user ‘root’@‘xxx.xxx.xxx.xxx’ (using p
[2023-09-18 11:28:44] mysqltest: Could not open ‘./mysql_test/test_suite/alter/t/alter_log_archive_option.test’ for reading
[ FAILED ]alter_log_archive_option ( 0.007815 s )
Reboot x
[ERROR] Keyboard Interrupt
Trace ID: 76773460-55d3-11ee-93f4-90e2ba838d44
If you want to view detailed obd logs, please run: obd display-trace 76773460-55d3-11ee-93f4-90e2ba838d44
然后web页面就停止服务了,
[root@oceanbase-173-241 ~]# obd cluster list
±-------------------------------------------------+
| Cluster List |
±-----±------------------------±----------------+
| Name | Configuration Path | Status (Cached) |
±-----±------------------------±----------------+
| demo | /root/.obd/cluster/demo | running |
| test | /root/.obd/cluster/test | deployed |
±-----±------------------------±----------------+
test状态也变了,
obd cluster start test
这个命令后报错卡在Start ocp-express x
报错内容:
[root@oceanbase-173-241 ~]# obd cluster start test
Get local repositories ok
Search plugins ok
Open ssh connection ok
Load cluster param plugin ok
Check before start observer ok
Check before start obproxy ok
Check before start obagent ok
Check before start prometheus ok
Check before start grafana ok
Check before start ocp-express ok
Start observer ok
observer program health check ok
Connect to observer ok
Start obproxy ok
obproxy program health check ok
Connect to obproxy ok
Initialize obproxy-ce ok
Start obagent ok
obagent program health check ok
Connect to Obagent ok
Start promethues ok
prometheus program health check ok
Connect to Prometheus ok
Initialize prometheus ok
Start grafana ok
grafana program health check ok
Connect to grafana ok
Initialize grafana ok
Start ocp-express x
[ERROR] 10.118.173.241: failed to connect meta db
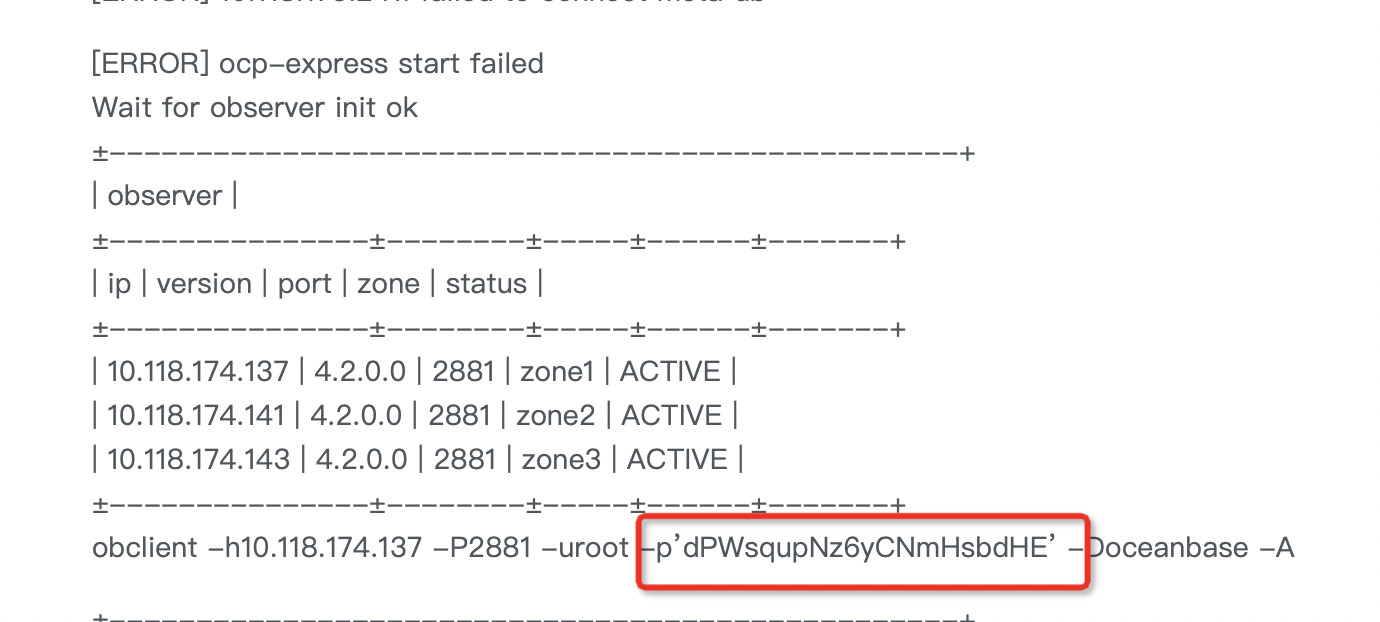
[ERROR] ocp-express start failed
Wait for observer init ok
±-------------------------------------------------+
| observer |
±---------------±--------±-----±------±-------+
| ip | version | port | zone | status |
±---------------±--------±-----±------±-------+
| 10.118.174.137 | 4.2.0.0 | 2881 | zone1 | ACTIVE |
| 10.118.174.141 | 4.2.0.0 | 2881 | zone2 | ACTIVE |
| 10.118.174.143 | 4.2.0.0 | 2881 | zone3 | ACTIVE |
±---------------±--------±-----±------±-------+
obclient -h10.118.174.137 -P2881 -uroot -p’dPWsqupNz6yCNmHsbdHE’ -Doceanbase -A
±-------------------------------------------------+
| obproxy |
±---------------±-----±----------------±-------+
| ip | port | prometheus_port | status |
±---------------±-----±----------------±-------+
| 10.118.174.132 | 2883 | 2884 | active |
±---------------±-----±----------------±-------+
obclient -h10.118.174.132 -P2883 -uroot -p’dPWsqupNz6yCNmHsbdHE’ -Doceanbase -A
±------------------------------------------------------------------+
| obagent |
±---------------±-------------------±-------------------±-------+
| ip | mgragent_http_port | monagent_http_port | status |
±---------------±-------------------±-------------------±-------+
| 10.118.174.137 | 8089 | 8088 | active |
| 10.118.174.141 | 8089 | 8088 | active |
| 10.118.174.143 | 8089 | 8088 | active |
±---------------±-------------------±-------------------±-------+
±---------------------------------------------------------+
| prometheus |
±---------------------------±------±-----------±-------+
| url | user | password | status |
±---------------------------±------±-----------±-------+
| http://10.118.173.241:9090 | admin | 7MjPIVKurg | active |
±---------------------------±------±-----------±-------+
±--------------------------------------------------------------------+
| grafana |
±---------------------------------------±------±----------±-------+
| url | user | password | status |
±---------------------------------------±------±----------±-------+
| http://10.118.173.241:3000/d/oceanbase | admin | Admin@123 | active |
±---------------------------------------±------±----------±-------+
See https://www.oceanbase.com/product/ob-deployer/error-codes .
Trace ID: a789a7f0-55e6-11ee-908f-90e2ba838d44
If you want to view detailed obd logs, please run: obd display-trace a789a7f0-55e6-11ee-908f-90e2ba838d44
[root@oceanbase-173-241 ~]#
Remote side unexpectedly closed network connection
【复现路径】问题出现前后相关操作
【问题现象及影响】
【附件】