【 使用环境 】生产环境 or 测试环境
【 OB or 其他组件 】
【 使用版本 】社区版 ocp 4.0.3
【问题描述】
社区版 ocp 4.0.3,
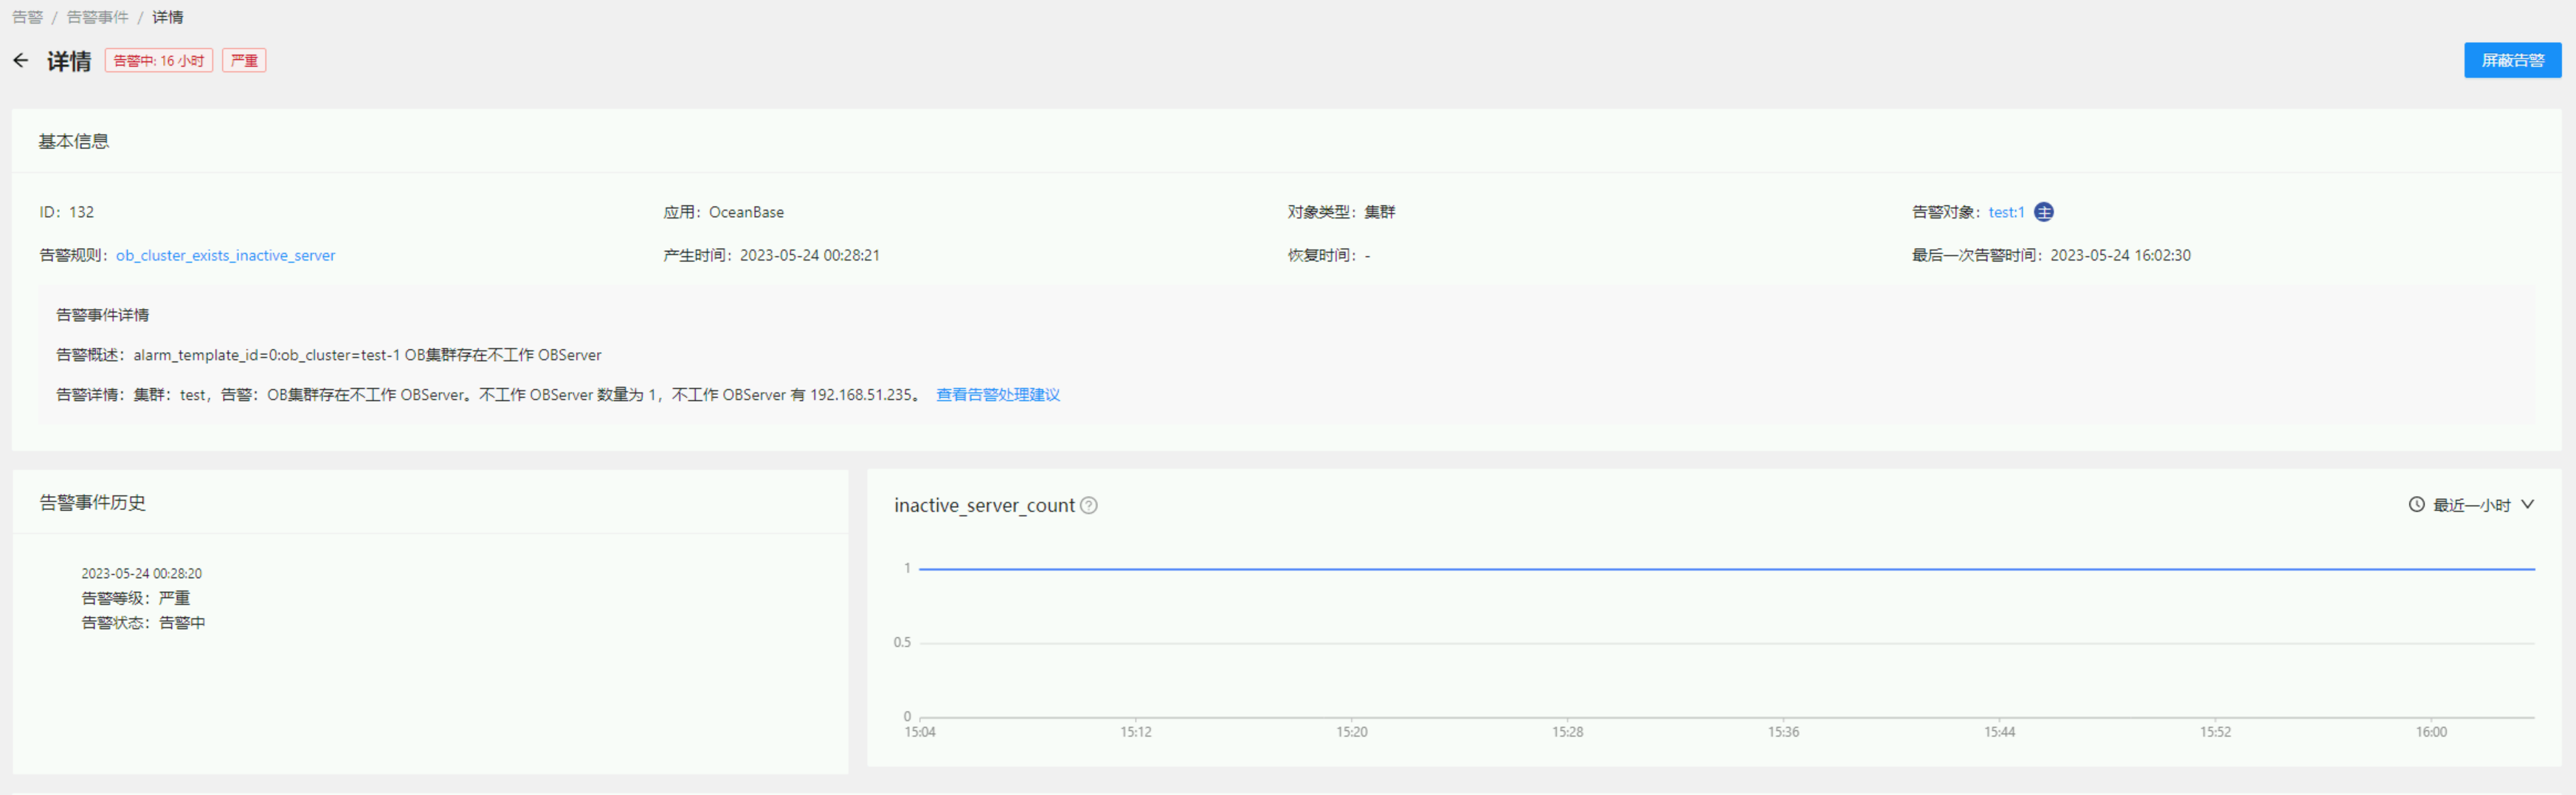
产生时间 2023-05-24 00:28:21 #当时确实有重启obsever的动作,重启成功后,这个报警也一直没有消失 如下图:
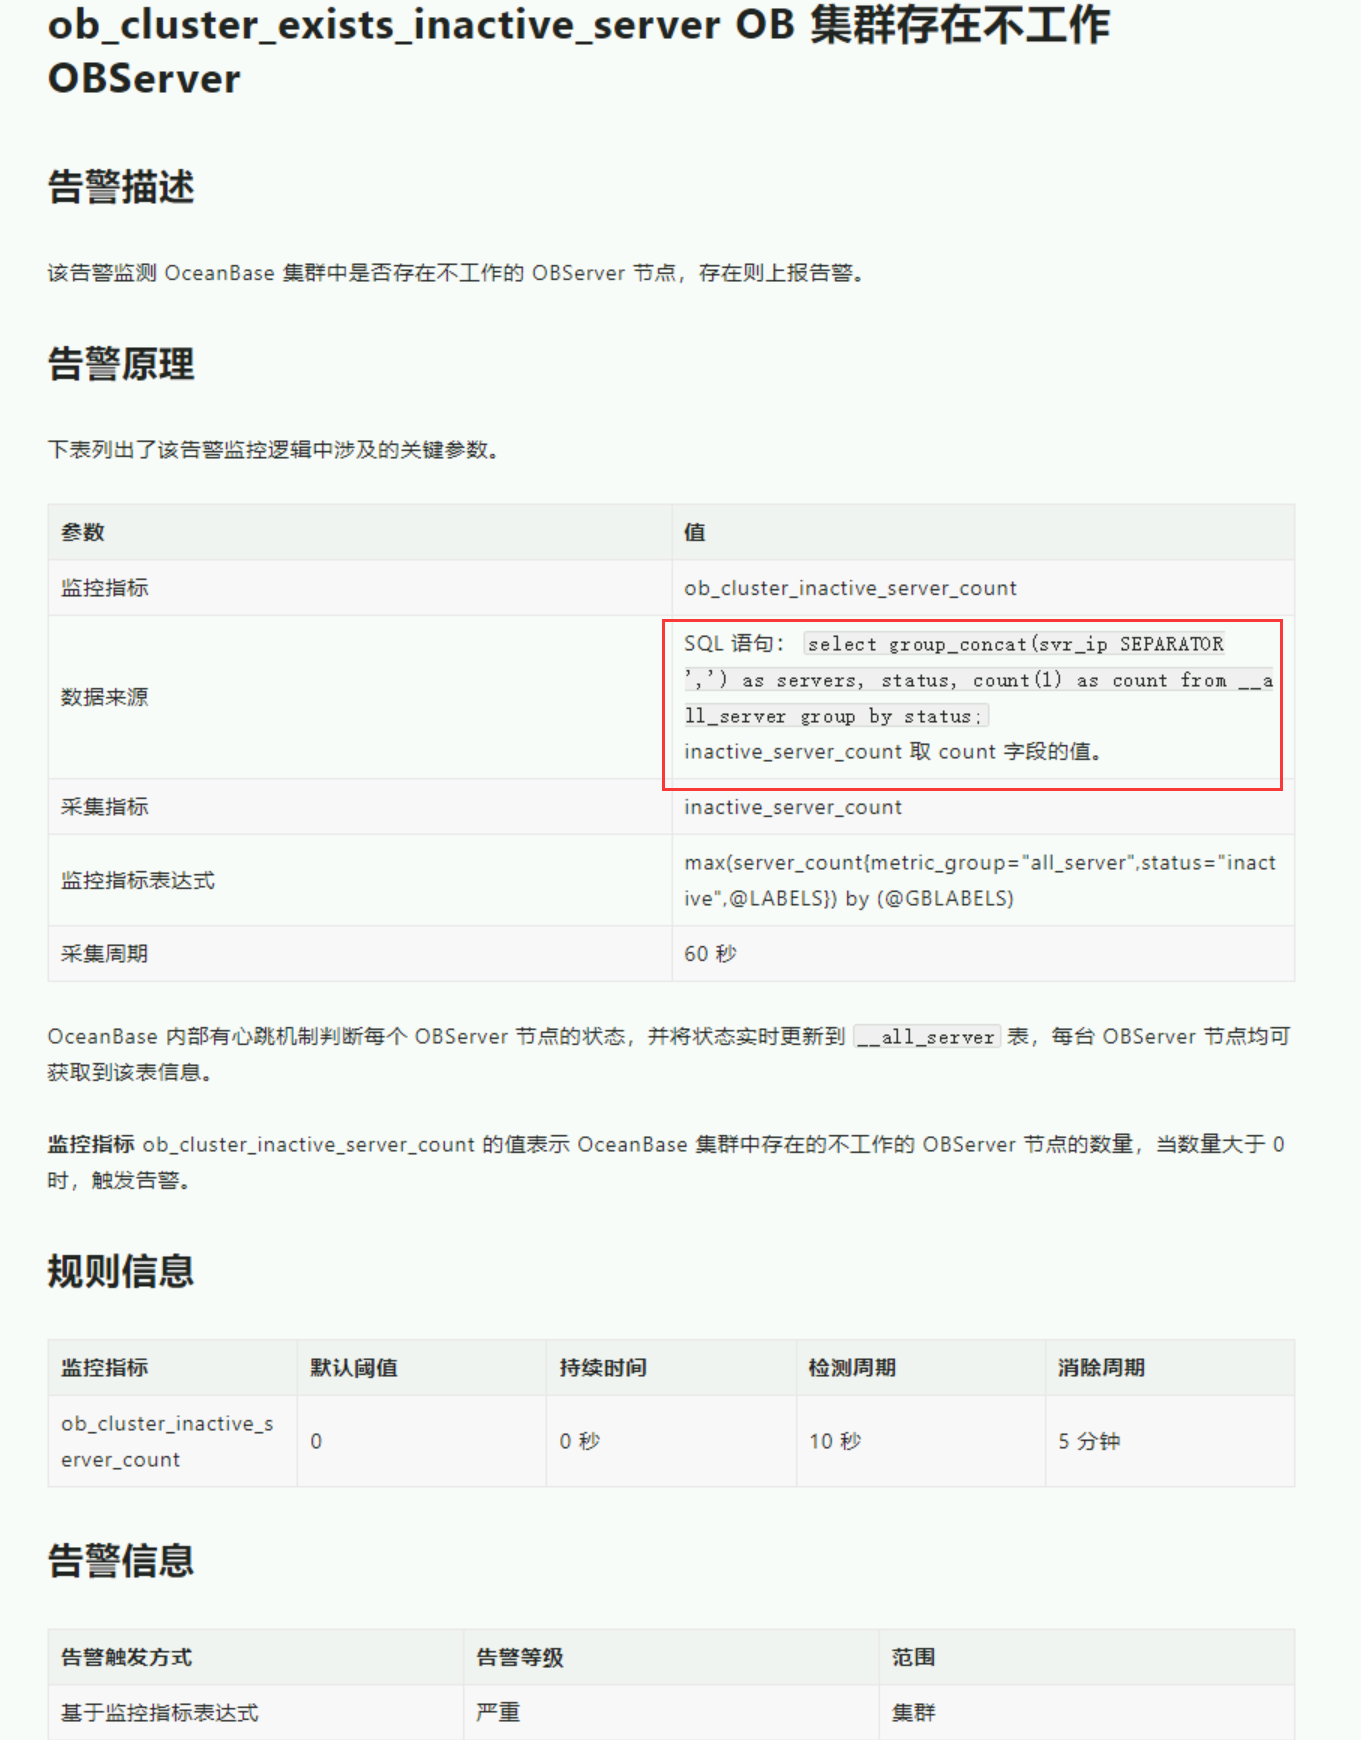
根据【查看告警处理建议】,的数据来源sql:
直接用里面的sql语句去ob上查看,结果也全是正常的,现在过去十几个小时了,报警还是一直存在, 请教一下,这个要如何处理才能让这个报警回归正常?
obclient [oceanbase]> select * from __all_server;
+----------------------------+----------------------------+----------------+----------+----+-------+------------+-----------------+--------+-----------------------+-------------------------------------------------------------------------------------------+-----------+--------------------+--------------+----------------+
| gmt_create                 | gmt_modified               | svr_ip         | svr_port | id | zone  | inner_port | with_rootserver | status | block_migrate_in_time | build_version                                                                             | stop_time | start_service_time | first_sessid | with_partition |
+----------------------------+----------------------------+----------------+----------+----+-------+------------+-----------------+--------+-----------------------+-------------------------------------------------------------------------------------------+-----------+--------------------+--------------+----------------+
| 2023-05-16 23:13:04.961738 | 2023-05-24 00:30:19.483399 | 192.168.51.233 |     2882 |  1 | zone1 |       2881 |               1 | ACTIVE |                     0 | 4.1.0.0_101010022023051821-f7379b26f8cd11f026e06846043550f9e0d42ead(May 18 2023 21:14:14) |         0 |   1684859359043863 |            0 |              1 |
| 2023-05-16 23:13:05.071981 | 2023-05-24 00:32:59.944848 | 192.168.51.234 |     2882 |  2 | zone2 |       2881 |               0 | ACTIVE |                     0 | 4.1.0.0_101010022023051821-f7379b26f8cd11f026e06846043550f9e0d42ead(May 18 2023 21:14:14) |         0 |   1684859579069033 |            0 |              1 |
| 2023-05-16 23:13:05.121000 | 2023-05-24 01:19:58.802255 | 192.168.51.235 |     2882 |  3 | zone3 |       2881 |               0 | ACTIVE |                     0 | 4.1.0.0_101010022023051821-f7379b26f8cd11f026e06846043550f9e0d42ead(May 18 2023 21:14:14) |         0 |   1684862383653846 |            0 |              1 |
+----------------------------+----------------------------+----------------+----------+----+-------+------------+-----------------+--------+-----------------------+-------------------------------------------------------------------------------------------+-----------+--------------------+--------------+----------------+
3 rows in set (0.001 sec)

obclient [oceanbase]> select group_concat(svr_ip SEPARATOR ',') as servers, status, count(1) as count from __all_server group by status;
+----------------------------------------------+--------+-------+
| servers                                      | status | count |
+----------------------------------------------+--------+-------+
| 192.168.51.233,192.168.51.235,192.168.51.234 | ACTIVE |     3 |
+----------------------------------------------+--------+-------+
1 row in set (0.001 sec)
秃蛙
#3
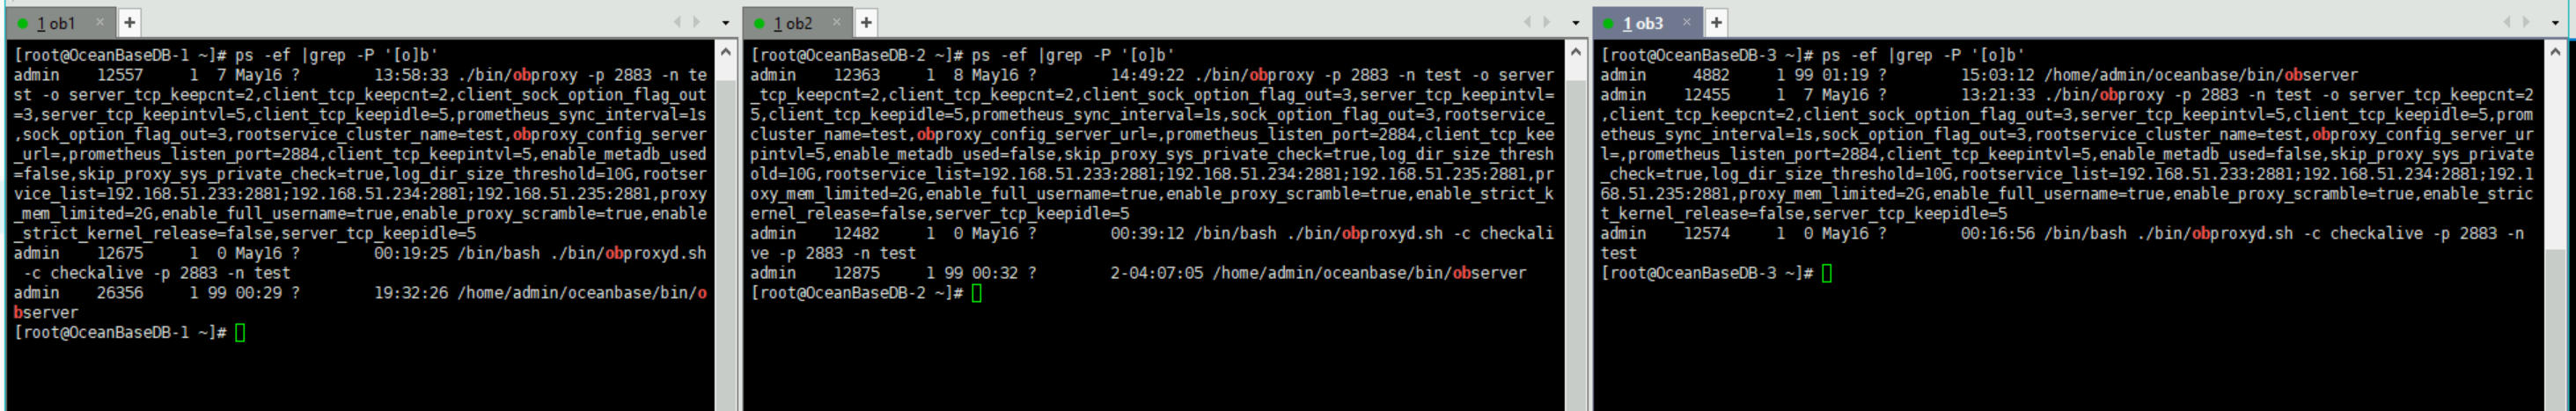
你好,看下重启节点的进程信息 ps -ef|grep obs |grep obs
进程所属和正常节点是否非同一个用户呢?
秃蛙
#4
ocp任务栏中是否有重启相关的未完成或者未失败的任务呢 如果有可以重试/放弃任务或者设置为成功。
秃蛙
#7
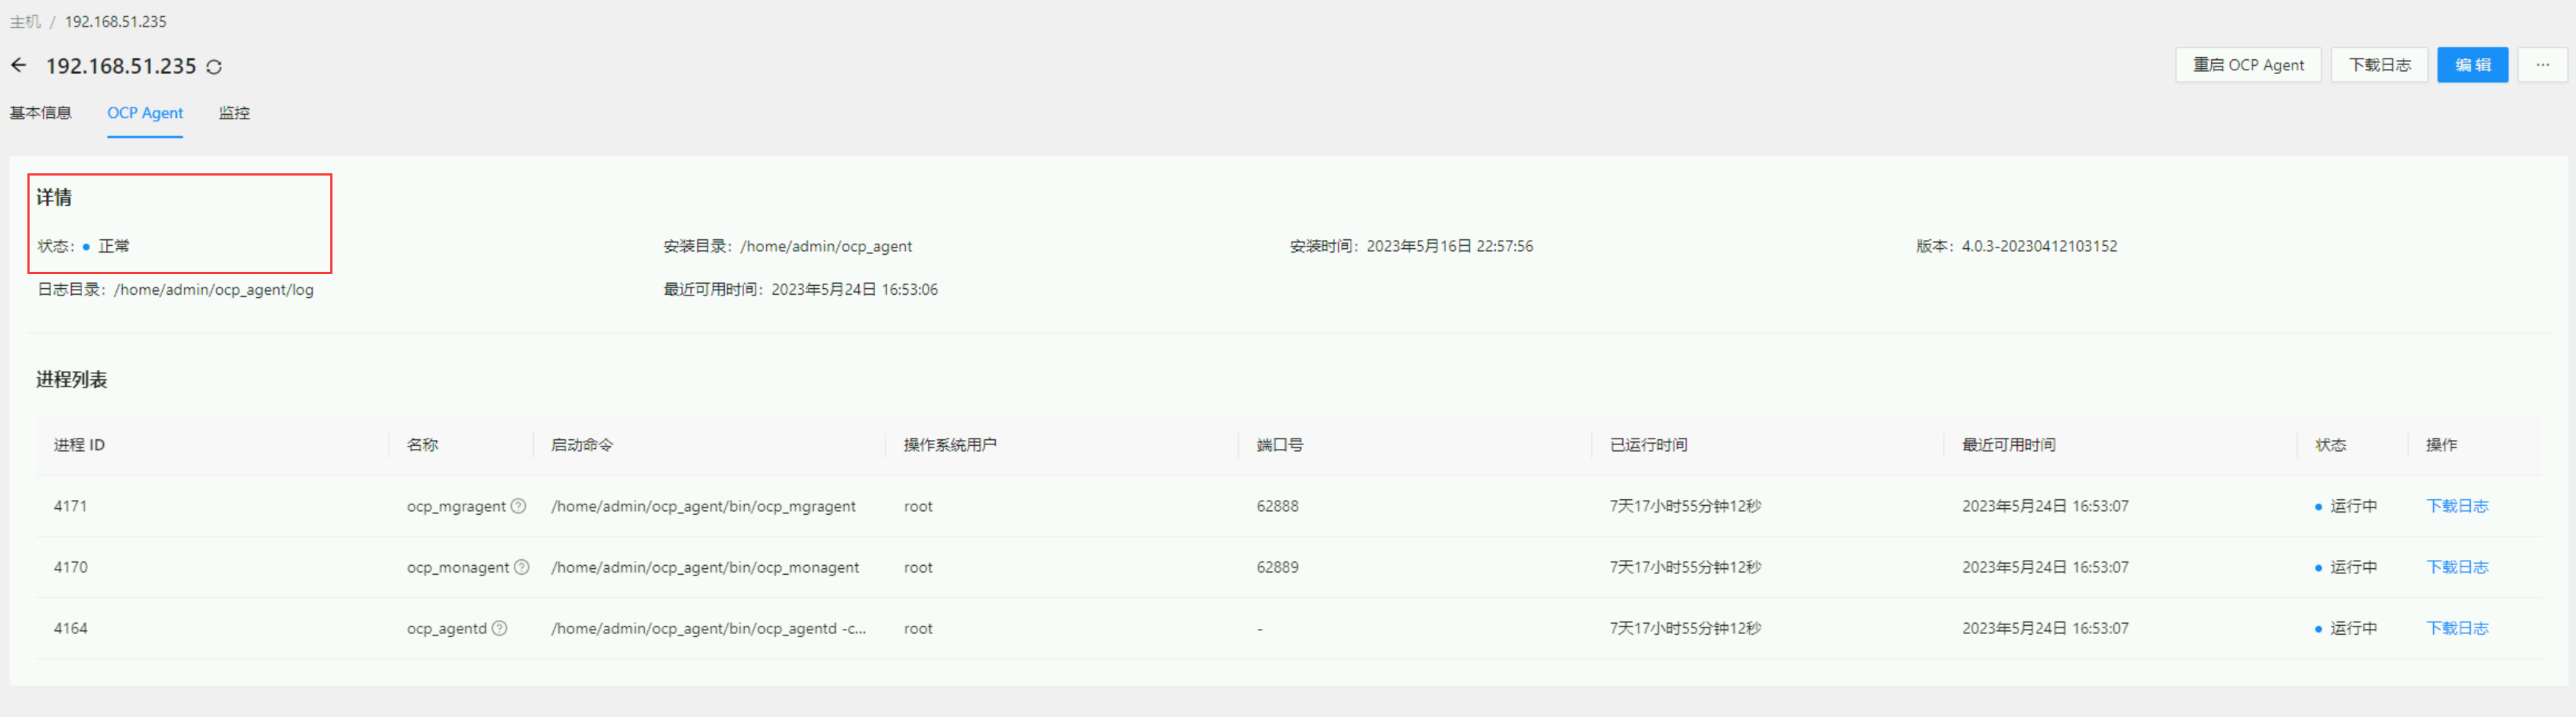
通过 OCP 的 主机列表 进入对应 OBServer 节点,查看 OCP Agent 页签中的进程是否正常。
正常的,这个一早就确认过了
刚刚试了一下,重启了 ocp agent, 这个报警也还是一直在
秃蛙
#10
235节点执行下:
sudo curl -s --unix-socket /home/admin/ocp_agent/run/ocp_monagent.$(cat /home/admin/ocp_agent/run/ocp_monagent.pid).sock http://unix-socket-server/metrics/ob/basic | grep ob_server_num
空的
不过另外两台有输出:
ob1
[root@OceanBaseDB-1 ~]#  curl -s --unix-socket /home/admin/ocp_agent/run/ocp_monagent.$(cat /home/admin/ocp_agent/run/ocp_monagent.pid).sock http://unix-socket-server/metrics/ob/basic  |grep ob_server_num
# HELP ob_server_num monitor collected message
# TYPE ob_server_num untyped
ob_server_num{app="OB",ob_cluster_id="1",ob_cluster_name="test",obregion="test",obzone="zone1",server_ips="192.168.51.233,192.168.51.235,192.168.51.234",status="ACTIVE",svr_ip="192.168.51.233"} 3
ob2
[root@OceanBaseDB-2 ~]# curl -s --unix-socket /home/admin/ocp_agent/run/ocp_monagent.$(cat /home/admin/ocp_agent/run/ocp_monagent.pid).sock http://unix-socket-server/metrics/ob/basic  |grep ob_server_num
# HELP ob_server_num monitor collected message
# TYPE ob_server_num untyped
ob_server_num{app="OB",ob_cluster_id="1",ob_cluster_name="test",obregion="test",obzone="zone2",server_ips="192.168.51.233,192.168.51.234",status="ACTIVE",svr_ip="192.168.51.234"} 2
ob_server_num{app="OB",ob_cluster_id="1",ob_cluster_name="test",obregion="test",obzone="zone2",server_ips="192.168.51.235",status="INACTIVE",svr_ip="192.168.51.234"} 1
秃蛙
#13
不带grep 看下访问返回什么信息
sudo curl -s --unix-socket /home/admin/ocp_agent/run/ocp_monagent.$(cat /home/admin/ocp_agent/run/ocp_monagent.pid).sock http://unix-socket-server/metrics/ob/basic
秃蛙
#14
write log failed write /home/admin/ocp_agent/log/monagent.log: no space left on device
235节点的磁盘空间看下。
/home/admin 在/目录下,空间有的
[admin@OceanBaseDB-3 run]$ df -h
Filesystem                 Size  Used Avail Use% Mounted on
devtmpfs                    32G     0   32G   0% /dev
tmpfs                       32G     0   32G   0% /dev/shm
tmpfs                       32G  9.0M   32G   1% /run
tmpfs                       32G     0   32G   0% /sys/fs/cgroup
/dev/mapper/centos-root     98G   72G   27G  73% /
/dev/sda1                 1014M  238M  777M  24% /boot
/dev/mapper/obdata-obdata  200G  180G   20G  91% /data
/dev/mapper/obredo-obredo  300G  270G   31G  90% /redo
tmpfs                      6.3G     0  6.3G   0% /run/user/1000
tmpfs                      6.3G     0  6.3G   0% /run/user/0
不grep 返回的就是一堆prometheus格式的监控指标
ob_server_num 这个监控项是集群中每台observer上都会生成的吗?
我看到ob2机器上是有 status=“INACTIVE” 的条目,所以把这台机器的ocp-agent 重启了,报警就正常了。 但ob2 上的 ob_server_num 条目也和 ob3 一样,不存在了,grep 输出为空。
秃蛙
#18
你好,可以把234节点的agent日志提供下吗,需要看下当时服务有什么异常。
monagent.log.gz (840.0 KB)
麻烦再帮看看 
报警出现的时间是: 2023-05-24 00:28:21
秃蛙
#21
当前ocp具体版本号是哪个呢。可以把安装包的包名提供下。
ocp-4.0.3-ce-x86_64.tar.gz
从官网上下的
https://www.oceanbase.com/softwarecenter