【 使用环境 】测试环境
【 OB or 其他组件 】OB
【 使用版本 】4.0
【问题描述】bod 安装ob,3节点+prometheus+grafana+obproxy,其中bod、prometheus、grafana、obproxy单独一台机器,grafana无法正常启动,请大神帮忙看看,具体是什么问题导致的。
【附件】

日志文件:
obd.log (309.6 KB)
【 使用环境 】测试环境
【 OB or 其他组件 】OB
【 使用版本 】4.0
【问题描述】bod 安装ob,3节点+prometheus+grafana+obproxy,其中bod、prometheus、grafana、obproxy单独一台机器,grafana无法正常启动,请大神帮忙看看,具体是什么问题导致的。
【附件】
日志文件:
obd.log (309.6 KB)
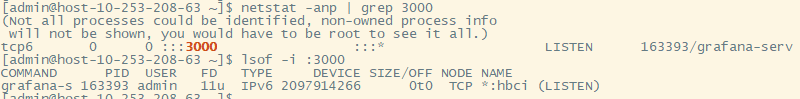
你尝试访问下3000端口,看下能否访问到,然后确认下3000端口是不是被占用等
你使用的是4.0的哪个版本?
最新的正式版。
oceanbase-all-in-one-4.0.0.0-100120230113164218.el7.x86_64.tar.gz
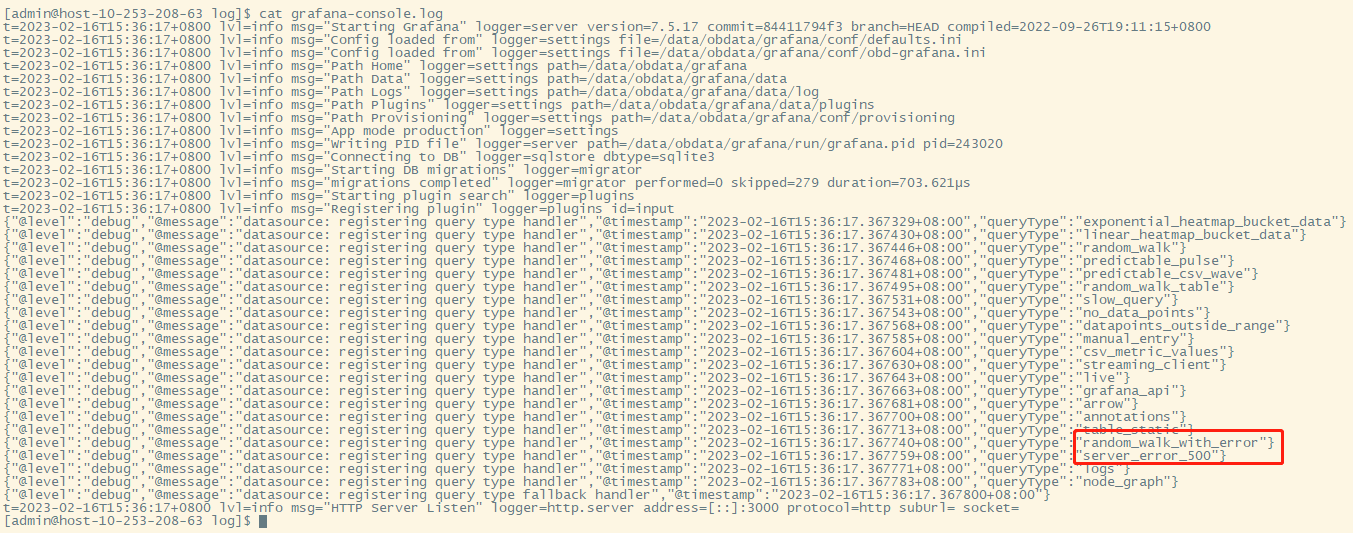
进到/data/obdata/grafana目录下面看下grafana的日志,在部署过程中有没有报错
请发一下obd的完整配置和obd的版本
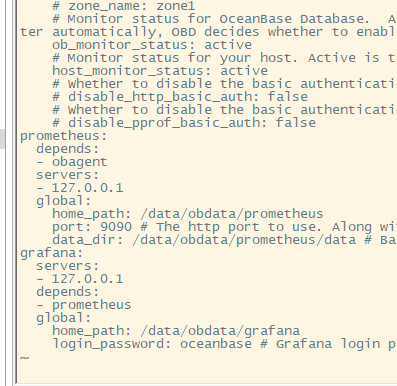
obagent的servers列表应该与oceanbase-ce的servers保持一致。
Prometheus缺少depends。
可以参考https://github.com/oceanbase/obdeploy/blob/master/example/all-components.yaml
将配置修改正确后,可以手动kill grafana的进程,再redeploy
重启很多次有时候又可以正常启动,这就难搞了。
问题描述中关于grafana的pid有两个,display中并没有grafana,却有对应的进程,是手动执行过启动 grafana吗?可以将目前的完整配置、obd日志发一下吗
oceanbase-ce:
servers:
- name: server1
ip: 10.253.208.65
- name: server2
ip: 10.253.208.67
- name: server3
ip: 10.253.208.172
global:
home_path: /home/admin/observer
devname: eth0
mysql_port: 2881
rpc_port: 2882
memory_limit: 10G # The maximum running memory for an observer
# system_memory: 30G
datafile_size: 100G # Size of the data file.
log_disk_size: 30G # The size of disk space used by the clog files.
syslog_level: ERROR # System log level. The default value is INFO.
enable_syslog_wf: false # Print system logs whose levels are higher than WARNING to a separate log file. The default value is true.
enable_syslog_recycle: true # Enable auto system log recycling or not. The default value is false.
max_syslog_file_count: 4 # The maximum number of reserved log files before enabling auto recycling. The default value is 0.
skip_proxy_sys_private_check: true
enable_strict_kernel_release: false
server1:
mysql_port: 2881
rpc_port: 2882
data_dir: /topevery/obdata
redo_dir: /topevery/obdata/redo
zone: zone1
server2:
mysql_port: 2881
rpc_port: 2882
data_dir: /data/obdata
redo_dir: /data/obdata/redo
zone: zone2
server3:
mysql_port: 2881
rpc_port: 2882
data_dir: /data/obdata
redo_dir: /data/obdata/redo
zone: zone3
obproxy-ce:
depends:
- oceanbase-ce
servers:
- 10.253.208.63
global:
listen_port: 2883 # External port. The default value is 2883.
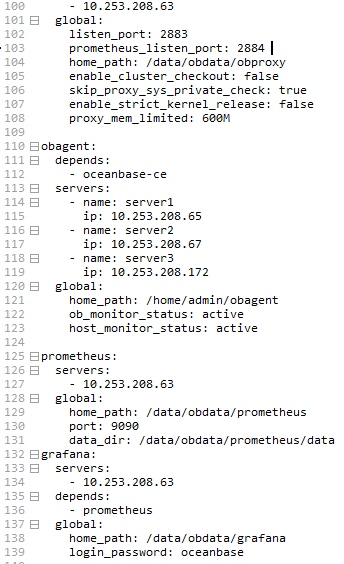
prometheus_listen_port: 2884 # The Prometheus port. The default value is 2884.
home_path: /data/obdata/obproxy
enable_cluster_checkout: false
skip_proxy_sys_private_check: true
enable_strict_kernel_release: false
obagent:
depends:
- oceanbase-ce
servers:
- name: server1
ip: 10.253.208.65
- name: server2
ip: 10.253.208.67
- name: server3
ip: 10.253.208.172
global:
home_path: /home/admin/obagent
ob_monitor_status: active
host_monitor_status: active ###
prometheus:
depends:
- obagent
servers:
- 10.253.208.63
global:
home_path: /data/obdata/prometheus
data_dir: /data/obdata/prometheus/data ###
grafana:
depends:
- prometheus
servers:
- 10.253.208.63
global:
home_path: /data/obdata/grafana
login_password: oceanbase
谢谢。
没有手工启动 grafana。
加上配置,重新创建集群还是同样存在问题。
目前配置看上去没有问题了。日志看服务也是正常启动的。grafana没有写回自身的pid。看上去是grafana内部发生了错误,或者是写会比较慢。可以cat /data/obdata/grafana/run/grafana.pid 看看pid是否写回了。如果有写回的化可以在执行一个start,进行状态校准。
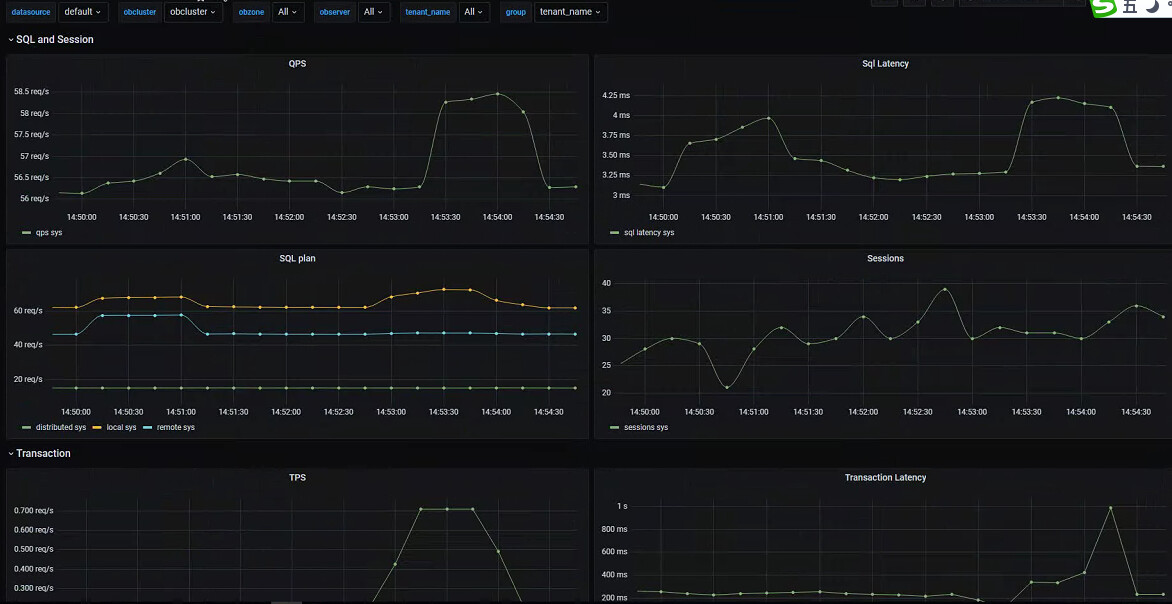
当前可以直接用admin/admin登录grafana进行使用。
另外能否在提供下os的版本,obd的版本,方便我们进行复现。
OS:
CentOS Linux release 7.6.1810 (Core) 、Linux version 3.10.0-957.el7.x86_64
obd:
OceanBase Deploy: 1.6.2
REVISION: 188385cf71729311c33df8cfa2d9b059ade337fd
BUILD_BRANCH: HEAD
BUILD_TIME: Dec 14 2022 11:34:49OURCE
Copyright (C) 2021 OceanBase
License GPLv3+: GNU GPL version 3 or later http://gnu.org/licenses/gpl.html.
This is free software: you are free to change and redistribute it.
There is NO WARRANTY, to the extent permitted by law.
pid有回写,再执行start,还是检查grafana通不过。
有时候停止再启动集群grafana,又能检查通过、有时候restart集群,会提示prometheus 已停止不能进行重启。
[admin@host-10-253-208-63 ~]$ netstat -anp | grep 3000
(Not all processes could be identified, non-owned process info
will not be shown, you would have to be root to see it all.)
tcp6 0 0 :::3000 :::* LISTEN 247480/grafana-serv
tcp6 0 0 10.253.208.63:3000 10.253.208.173:49377 ESTABLISHED 247480/grafana-serv
tcp6 0 0 10.253.208.63:3000 10.253.208.173:49359 ESTABLISHED 247480/grafana-serv
tcp6 0 0 10.253.208.63:3000 10.253.208.173:49376 ESTABLISHED 247480/grafana-serv
tcp6 0 0 10.253.208.63:3000 10.253.208.173:49375 ESTABLISHED 247480/grafana-serv
tcp6 0 0 10.253.208.63:3000 10.253.208.173:49329 ESTABLISHED 247480/grafana-serv
[admin@host-10-253-208-63 ~]$ cat /data/obdata/grafana/run/grafana.pid
247480[admin@host-10-253-208-63 ~]$
[admin@host-10-253-208-63 ~]$ obd cluster start observer
Get local repositories ok
Search plugins ok
Open ssh connection ok
Load cluster param plugin ok
Check before start observer ok
Check before start obproxy ok
Check before start obagent ok
Check before start prometheus ok
Check before start grafana ok
Start observer ok
observer program health check ok
Connect to observer ok
Initialize cluster ok
Start obproxy ok
obproxy program health check ok
Connect to obproxy ok
Initialize cluster ok
Start obagent ok
obagent program health check ok
Start promethues ok
prometheus program health check ok
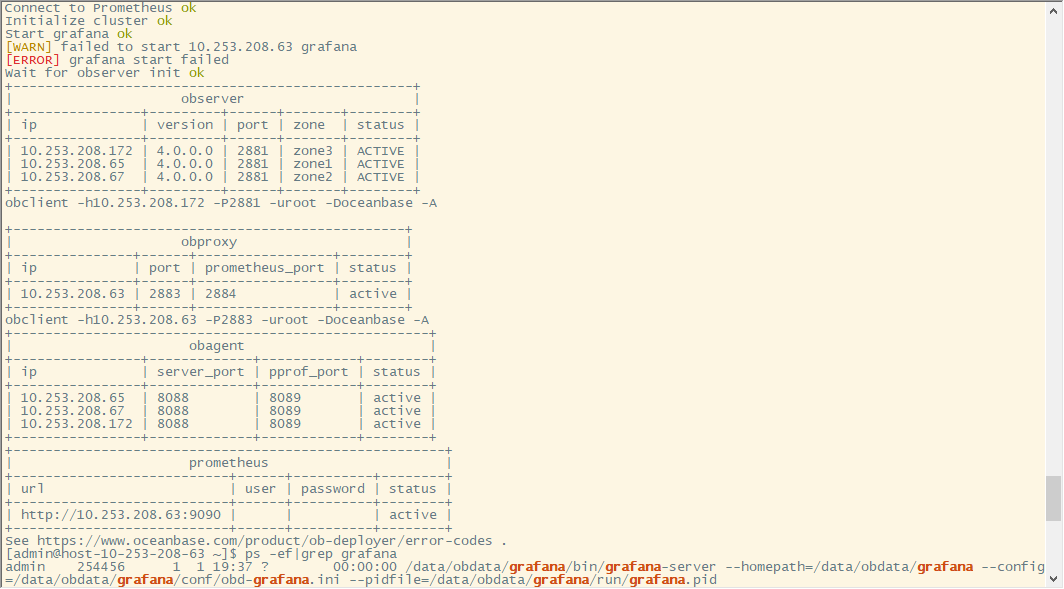
Connect to Prometheus ok
Initialize cluster ok
Start grafana ok
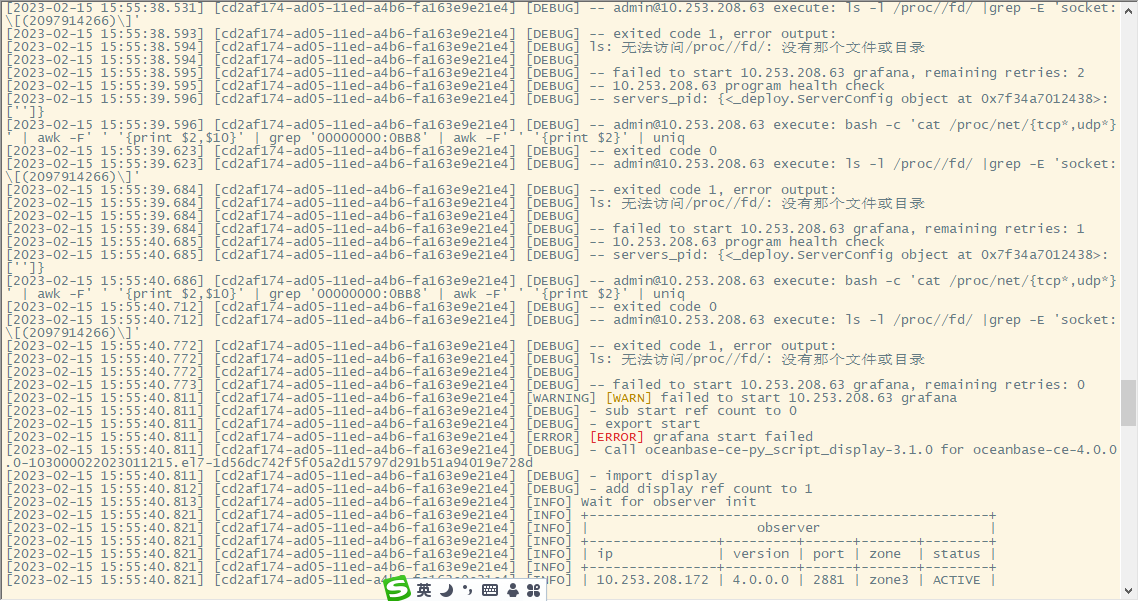
[WARN] failed to start 10.253.208.63 grafana
[ERROR] grafana start failed
Wait for observer init ok
+--------------------------------------------------+
| observer |
+----------------+---------+------+-------+--------+
| ip | version | port | zone | status |
+----------------+---------+------+-------+--------+
| 10.253.208.172 | 4.0.0.0 | 2881 | zone3 | ACTIVE |
| 10.253.208.65 | 4.0.0.0 | 2881 | zone1 | ACTIVE |
| 10.253.208.67 | 4.0.0.0 | 2881 | zone2 | ACTIVE |
+----------------+---------+------+-------+--------+
obclient -h10.253.208.172 -P2881 -uroot -Doceanbase -A
+-------------------------------------------------+
| obproxy |
+---------------+------+-----------------+--------+
| ip | port | prometheus_port | status |
+---------------+------+-----------------+--------+
| 10.253.208.63 | 2883 | 2884 | active |
+---------------+------+-----------------+--------+
obclient -h10.253.208.63 -P2883 -uroot -Doceanbase -A
+----------------------------------------------------+
| obagent |
+----------------+-------------+------------+--------+
| ip | server_port | pprof_port | status |
+----------------+-------------+------------+--------+
| 10.253.208.65 | 8088 | 8089 | active |
| 10.253.208.67 | 8088 | 8089 | active |
| 10.253.208.172 | 8088 | 8089 | active |
+----------------+-------------+------------+--------+
+------------------------------------------------------+
| prometheus |
+---------------------------+------+----------+--------+
| url | user | password | status |
+---------------------------+------+----------+--------+
| http://10.253.208.63:9090 | | | active |
+---------------------------+------+----------+--------+
See https://www.oceanbase.com/product/ob-deployer/error-codes .
[admin@host-10-253-208-63 ~]$
[admin@host-10-253-208-63 ~]$
[admin@host-10-253-208-63 ~]$ obd cluster restart observer
Get local repositories and plugins ok
Load cluster param plugin ok
Open ssh connection ok
Cluster status check ok
Connect to observer ok
Server check ok
Observer restart ok
Wait for observer init ok
+--------------------------------------------------+
| observer |
+----------------+---------+------+-------+--------+
| ip | version | port | zone | status |
+----------------+---------+------+-------+--------+
| 10.253.208.172 | 4.0.0.0 | 2881 | zone3 | ACTIVE |
| 10.253.208.65 | 4.0.0.0 | 2881 | zone1 | ACTIVE |
| 10.253.208.67 | 4.0.0.0 | 2881 | zone2 | ACTIVE |
+----------------+---------+------+-------+--------+
obclient -h10.253.208.172 -P2881 -uroot -Doceanbase -A
Stop obproxy ok
Start obproxy ok
obproxy program health check ok
Connect to obproxy ok
+-------------------------------------------------+
| obproxy |
+---------------+------+-----------------+--------+
| ip | port | prometheus_port | status |
+---------------+------+-----------------+--------+
| 10.253.208.63 | 2883 | 2884 | active |
+---------------+------+-----------------+--------+
obclient -h10.253.208.63 -P2883 -uroot -Doceanbase -A
Stop obagent ok
Start obagent ok
obagent program health check ok
+----------------------------------------------------+
| obagent |
+----------------+-------------+------------+--------+
| ip | server_port | pprof_port | status |
+----------------+-------------+------------+--------+
| 10.253.208.65 | 8088 | 8089 | active |
| 10.253.208.67 | 8088 | 8089 | active |
| 10.253.208.172 | 8088 | 8089 | active |
+----------------+-------------+------------+--------+
Stop prometheus ok
Start promethues ok
prometheus program health check ok
Connect to prometheus ok
+------------------------------------------------------+
| prometheus |
+---------------------------+------+----------+--------+
| url | user | password | status |
+---------------------------+------+----------+--------+
| http://10.253.208.63:9090 | | | active |
+---------------------------+------+----------+--------+
Stop grafana ok
Start grafana ok
grafana program health check ok
Connect to Grafana ok
+---------------------------------------------------------------------+
| grafana |
+---------------------------------------+-------+----------+----------+
| url | user | password | status |
+---------------------------------------+-------+----------+----------+
| http://10.253.208.63:3000/d/oceanbase | admin | admin | inactive |
+---------------------------------------+-------+----------+----------+
observer restart
[admin@host-10-253-208-63 ~]$ obd cluster restart observer
Get local repositories and plugins ok
Load cluster param plugin ok
Open ssh connection ok
Cluster status check ok
Connect to observer ok
Server check ok
Observer restart ok
Wait for observer init ok
+--------------------------------------------------+
| observer |
+----------------+---------+------+-------+--------+
| ip | version | port | zone | status |
+----------------+---------+------+-------+--------+
| 10.253.208.172 | 4.0.0.0 | 2881 | zone3 | ACTIVE |
| 10.253.208.65 | 4.0.0.0 | 2881 | zone1 | ACTIVE |
| 10.253.208.67 | 4.0.0.0 | 2881 | zone2 | ACTIVE |
+----------------+---------+------+-------+--------+
obclient -h10.253.208.172 -P2881 -uroot -Doceanbase -A
Stop obproxy ok
Start obproxy ok
obproxy program health check ok
Connect to obproxy ok
+-------------------------------------------------+
| obproxy |
+---------------+------+-----------------+--------+
| ip | port | prometheus_port | status |
+---------------+------+-----------------+--------+
| 10.253.208.63 | 2883 | 2884 | active |
+---------------+------+-----------------+--------+
obclient -h10.253.208.63 -P2883 -uroot -Doceanbase -A
Stop obagent ok
Start obagent ok
obagent program health check ok
+----------------------------------------------------+
| obagent |
+----------------+-------------+------------+--------+
| ip | server_port | pprof_port | status |
+----------------+-------------+------------+--------+
| 10.253.208.65 | 8088 | 8089 | active |
| 10.253.208.67 | 8088 | 8089 | active |
| 10.253.208.172 | 8088 | 8089 | active |
+----------------+-------------+------------+--------+
Stop prometheus ok
Start promethues ok
prometheus program health check ok
Connect to prometheus ok
+------------------------------------------------------+
| prometheus |
+---------------------------+------+----------+--------+
| url | user | password | status |
+---------------------------+------+----------+--------+
| http://10.253.208.63:9090 | | | active |
+---------------------------+------+----------+--------+
Stop grafana ok
Start grafana ok
[WARN] failed to start 10.253.208.63 grafana
See https://www.oceanbase.com/product/ob-deployer/error-codes .
[admin@host-10-253-208-63 ~]$
刚刚重启一下,正常了,再重启一下又是检查未通过。
麻烦上面的操作对应的obd日志完整发一下,方便排查
“pid有回写,再执行start,还是检查grafana通不过。”
看日志是启动后读取Pid文件为空导致检查不通过。但事实上grafana的启动是没有问题的,只是启动慢。我们后续会优化这个启动检查,延迟pid检查的时间。