【 使用环境 】生产环境
【 OB or 其他组件 】oms
【 使用版本 】ob版本为社区版4.2.5.5和社区版4.2.5.1,oms版本为4.2.11_CE
【问题描述】
源端为ob社区版4.2.5.1
目标端为ob版本为社区版4.2.5.5
现在已经将4.2.5.1上的一个租户通过OMS同步到了4.2.5.5上,并且正向同步已经切换完毕,当开启反向同步后,一直提示反向同步延迟
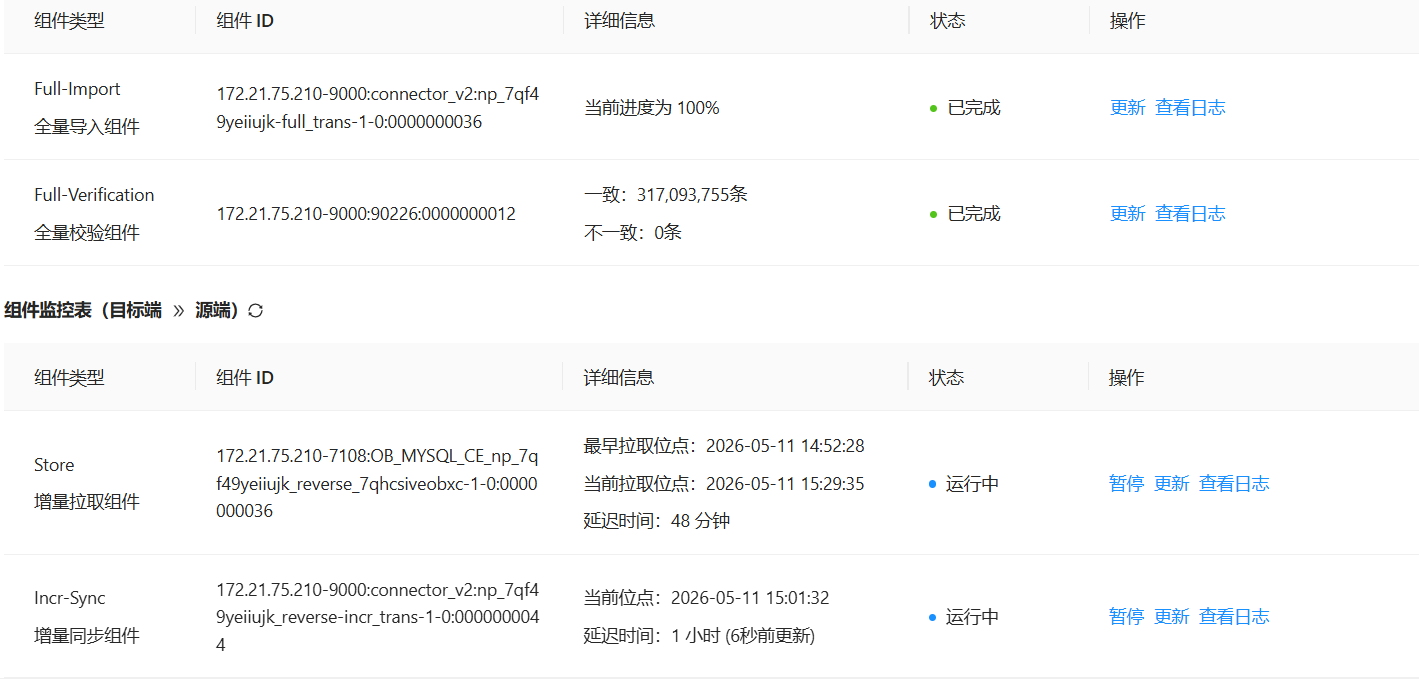
进入incr-sync组件执行./connector_utils.sh diagnose提示如下
2026-05-11 16:18:51 INFO status:FINISHED
[Metrics]
[DataFlow]
[Delay]
delay:4634000ms,sourceDelay:4131808ms
sinkDelay:4139673ms
delayTrend:4159s->4159s->4159s->4144s->4147s->4149s->4149s->4139s->4129s->4132s->4131s->4139s->4139s
[ERROR_LOG]
STOPPED
[GcMetrics]
youngMem:2048M,fullMem:2048M,heap:1652M/4096M,noHeapUsed:76M
[youngGc-ParNew]costMsAvg:0.24,countPreSec:0.02
[fullGc-ConcurrentMarkSweep]costMsAvg:0.0,countPreSec:0.0
[Kafka]
[COORDINATOR_QUEUE]
waitRecords:2.0,readyBatch:0.0,totalRecordsInQueue:2.0,sourceRecordAccumulate:0.0
sourceBlock:true,sinkBlock:false
[RPS]
Rps[last:0.0,avg:526.0]
Iops[last:0.0M,avg:1.05M]
RPS_TREND[401->401->0->1293->108->616->0->401->1219->201->94->0->0]
[SinkMetrics]
execute/Record:2.0ms,commit/Batch:2.0ms,sinkBatchSizeAvg:2.45
execute(p99)/Record:3.0ms,commit(p99)/Batch:4.0ms
lastSinkThread:0/64
shardTime:0.0ms
[store]
OB_MYSQL_CE_np_7qf49yeiiujk_reverse_7qhcsiveobxc-1-0:rps:139395.512,iops:217.354M,delay:4131.411s,connNum:1
[Scene] StoreParserSlowScene
可能存在源端投递数据瓶颈
执行./connector_utils.sh metrics,提示如下
2026-05-11 16:19:16 INFO
2026-05-11 16:18:56.919
SOURCE: [RPS:1733.35, IOPS:4.18M, delay:4117670ms]
SINK: [RPS:2788.72, TPS:1135.73, IOPS:5.807M, delay:4117695ms]
SINK_TIME: [execute_time:2.25ms/record, commit_time:3.93ms/batch]
SINK_SLOW_ROUTES:
SINK_THREAD: 13/64
DISPATCHER: wait record:19, ready batch:5, shardTime:nullms/record
forward_slot0 batchAccumulate: 0, recordAccumulate: 0
queue_slot1 batchAccumulate: 0, recordAccumulate: 0
heap:1557M/3891M, noHeap:76M/488M, threadCount:81, cpu:2.495, sysCpu:64.869
ParNew(count:51, cost:1199) ConcurrentMarkSweep(count:0, cost:0)
2026-05-11 16:19:16 INFO
2026-05-11 16:19:06.919
SOURCE: [RPS:446.2, IOPS:1.032M, delay:4112695ms]
SINK: [RPS:92.06, TPS:251.3, IOPS:0.193M, delay:4114940ms]
SINK_TIME: [execute_time:2.25ms/record, commit_time:3.21ms/batch]
SINK_SLOW_ROUTES:
SINK_THREAD: 0/64
DISPATCHER: wait record:0, ready batch:0, shardTime:nullms/record
forward_slot0 batchAccumulate: 0, recordAccumulate: 0
queue_slot1 batchAccumulate: 0, recordAccumulate: 0
heap:305M/3891M, noHeap:76M/488M, threadCount:81, cpu:0.889, sysCpu:39.848
ParNew(count:52, cost:1221) ConcurrentMarkSweep(count:0, cost:0)
2026-05-11 16:19:17 INFO
2026-05-11 16:19:16.920
SOURCE: [RPS:400.2, IOPS:0.739M, delay:4663920ms]
SINK: [RPS:400.16, TPS:6.4, IOPS:0.739M, delay:4109412ms]
SINK_TIME: [execute_time:1.52ms/record, commit_time:1.11ms/batch]
SINK_SLOW_ROUTES:
SINK_THREAD: 0/64
DISPATCHER: wait record:0, ready batch:0, shardTime:nullms/record
forward_slot0 batchAccumulate: 0, recordAccumulate: 0
queue_slot1 batchAccumulate: 0, recordAccumulate: 0
heap:399M/3891M, noHeap:76M/488M, threadCount:81, cpu:0.491, sysCpu:49.472
ParNew(count:52, cost:1221) ConcurrentMarkSweep(count:0, cost:0)
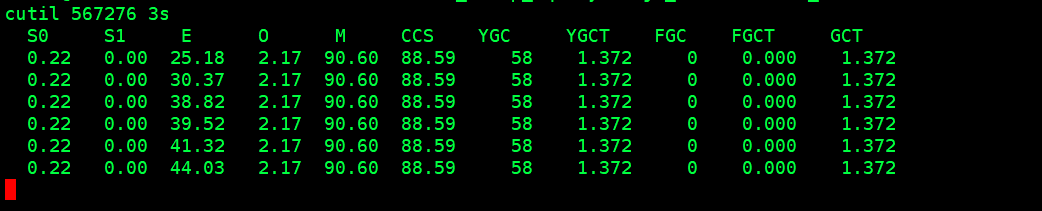
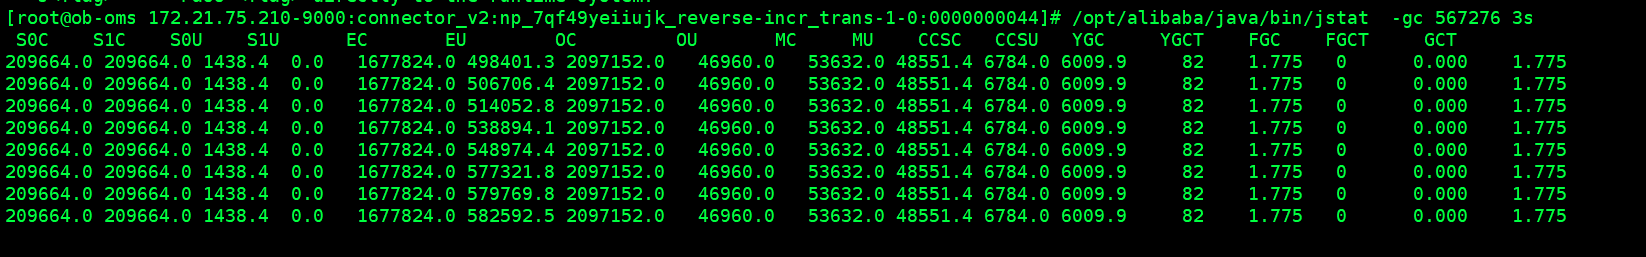
检查该java进程