正在处理:ocp没有监控数据.7z…
链接:https://foreignfile.catl.com/outpublish.html?code=A750eddb72ff04f2d85c1a8f0e6f35b85&lang=zh-cn#view
密码:5BBA052C
4 个赞
链接:https://foreignfile.catl.com/outpublish.html?code=A750eddb72ff04f2d85c1a8f0e6f35b85&lang=zh-cn#view
密码:5BBA052C
日志不能外发,被拦截了,我上传到这里了,看看这个能打开不
4 个赞
这个集群各节点的IP是什么
2025-12-29T11:26:23.33671+08:00 INFO [337983,75240fae7ea847a7] caller=common/middleware.go:60:func1: API request: [GET /metrics/stat, client=10.38.14.21, ocpServerIp=, traceId=75240fae7ea847a7, body=]
2025-12-29T11:26:23.38291+08:00 INFO [337983,910da67a09d92a97] caller=common/middleware.go:60:func1: API request: [GET /metrics/ob/basic, client=10.38.37.221, ocpServerIp=, traceId=910da67a09d92a97, body=]
2025-12-29T11:26:23.38296+08:00 ERROR [337983,] caller=common/middleware_auth.go:65:Authorize: invalid header authorization: , should contain 2 content. url: /metrics/ob/basic
2025-12-29T11:26:23.38304+08:00 ERROR [337983,910da67a09d92a97] caller=web/http_server.go:50:AuthorizeMiddleware: basic auth Authorize failed, err:OcpAgentError: code = 1101, message = Authentication failed for invalid header authorization fields: url=/metrics/ob/basic
2025-12-29T11:26:25.66655+08:00 ERROR [337983,] caller=common/middleware_auth.go:65:Authorize: invalid header authorization: , should contain 2 content. url: /metrics/obproxy
2025-12-29T11:26:25.66688+08:00 ERROR [337983,c174ba90b3791d4e] caller=web/http_server.go:50:AuthorizeMiddleware: basic auth Authorize failed, err:OcpAgentError: code = 1101, message = Authentication failed for invalid header authorization fields:, url=/metrics/obproxy
2025-12-29T11:26:25.66648+08:00 INFO [337983,] caller=logtailer/log_tailer_executor.go:360:getWatchedNewLogs: getLogsWithinTime match file fields:, matchedFileRealPath=/home/admin/CatlCloudDBtst/oceanbase/log/observer.log.20251229112610991
2025-12-29T11:26:27.61063+08:00 WARN [337983,606e7e9ccc907c2b] caller=mysql/table_input.go:401:collectData: slow sql, name: ob_system_event, duration: 15.54191752s (over 100ms), sql: select /* MONITOR_AGENT */ con_id tenant_id, wait_class as event_group, sum(total_waits) as total_waits, sum(time_waited_micro / 1000000) as time_waited from v$system_event where v$system_event.wait_class <> 'IDLE' and (con_id > 1000 or con_id = 1) group by tenant_id, event_group
2025-12-29T11:26:27.61289+08:00 WARN [337983,606e7e9ccc907c2b] caller=common/input_cache.go:47:Update: update cache for key ob_system_event, err: collect ob_metric ob_system_event timeout
github.com/oceanbase/obagent/monitor/plugins/inputs/mysql.(*TableInput).collectData
	/workspace/code-repo/rpm/.rpm_create/SOURCES/ocp-agent-ce/monitor/plugins/inputs/mysql/table_input.go:489
github.com/oceanbase/obagent/monitor/plugins/inputs/mysql.(*TableInput).InitCache.func1
	/workspace/code-repo/rpm/.rpm_create/SOURCES/ocp-agent-ce/monitor/plugins/inputs/mysql/table_input.go:211
github.com/oceanbase/obagent/monitor/plugins/common.(*InputCache).Update
	/workspace/code-repo/rpm/.rpm_create/SOURCES/ocp-agent-ce/monitor/plugins/common/input_cache.go:45
runtime.goexit
	/home/admin/go/src/runtime/asm_amd64.s:1598
Caused by: io.netty.channel.AbstractChannel$AnnotatedNoRouteToHostException: No route to host: /10.200.2.124:62889
Caused by: java.net.NoRouteToHostException: No route to host
	at sun.nio.ch.SocketChannelImpl.checkConnect(Native Method)
	at sun.nio.ch.SocketChannelImpl.finishConnect(SocketChannelImpl.java:714)
	at io.netty.channel.socket.nio.NioSocketChannel.doFinishConnect(NioSocketChannel.java:337)
	at io.netty.channel.nio.AbstractNioChannel$AbstractNioUnsafe.finishConnect(AbstractNioChannel.java:334)
	at io.netty.channel.nio.NioEventLoop.processSelectedKey(NioEventLoop.java:776)
	at io.netty.channel.nio.NioEventLoop.processSelectedKeysOptimized(NioEventLoop.java:724)
	at io.netty.channel.nio.NioEventLoop.processSelectedKeys(NioEventLoop.java:650)
	at io.netty.channel.nio.NioEventLoop.run(NioEventLoop.java:562)
	at io.netty.util.concurrent.SingleThreadEventExecutor$4.run(SingleThreadEventExecutor.java:997)
	at io.netty.util.internal.ThreadExecutorMap$2.run(ThreadExecutorMap.java:74)
	at java.lang.Thread.run(Thread.java:748)

2025-12-29 14:05:23.362  INFO 31051 --- [metric-parse-9,,] c.o.o.m.s.OcpMetricCollectServiceImpl    : Collect failed, exporter=http://10.200.2.124:62889/metrics/stat, collectAt=1766988323, message=java.net.ConnectException: No route to host: /10.200.2.124:62889, rootCause=NoRouteToHostException: No route to host
4 个赞
业务集群名 CatlCloudDBtst
集群节点IP :10.38.14.23 、10.38.14.24、10.38.14.25
3 个赞
2025-12-29T09:21:18.66653+08:00 INFO [368767,] caller=logtailer/log_tailer_executor.go:360:getWatchedNewLogs: getLogsWithinTime match file fields: matchedFileRealPath=/home/admin/CatlCloudDBtst/oceanbase/log/trace.log
2025-12-29T09:21:18.70418+08:00 ERROR [368767,cde06c8e26a4d65f] caller=engine/route_manager.go:212:ServeHTTP: failed to write http response from buffer fields: error="write tcp 10.38.14.23:62889->10.38.14.21:65256: write: broken pipe"
2025-12-29T09:21:18.70426+08:00 INFO [368767,cde06c8e26a4d65f] caller=common/middleware.go:64:func1: request end fields: duration=3.599781244s, status=200, ocpServerIp=, client=10.38.14.21, url=/metrics/ob/basic
@旭辉 这个是啥问题?
3 个赞
跟这个帖子 报错类似,但是按照这个帖子方法来 操作,没效果。
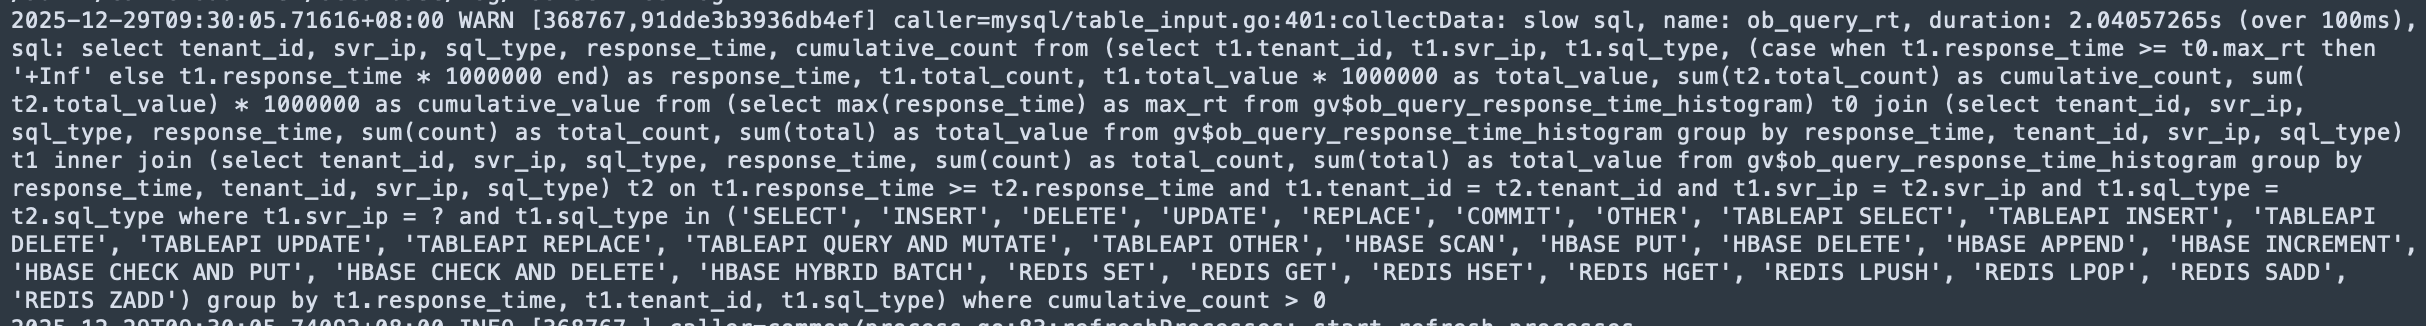
sql 诊断 没有数据,但是我在业务库查询给gv$ob_sql_audit 是有纪录的。
4 个赞
学习一下
3 个赞
版本太低了
2 个赞
升级到 4.4.0 的monagent 还是不行,没有监控数据。
2025-12-30T13:31:18.75933+08:00 ERROR [337983,cd84a61265620f21] caller=common/adapter_common.go:23:1: failed to write http response from buffer fields: error="write tcp 10.38.14.23:62889->10
.38.14.21:62160: write: broken pipe"
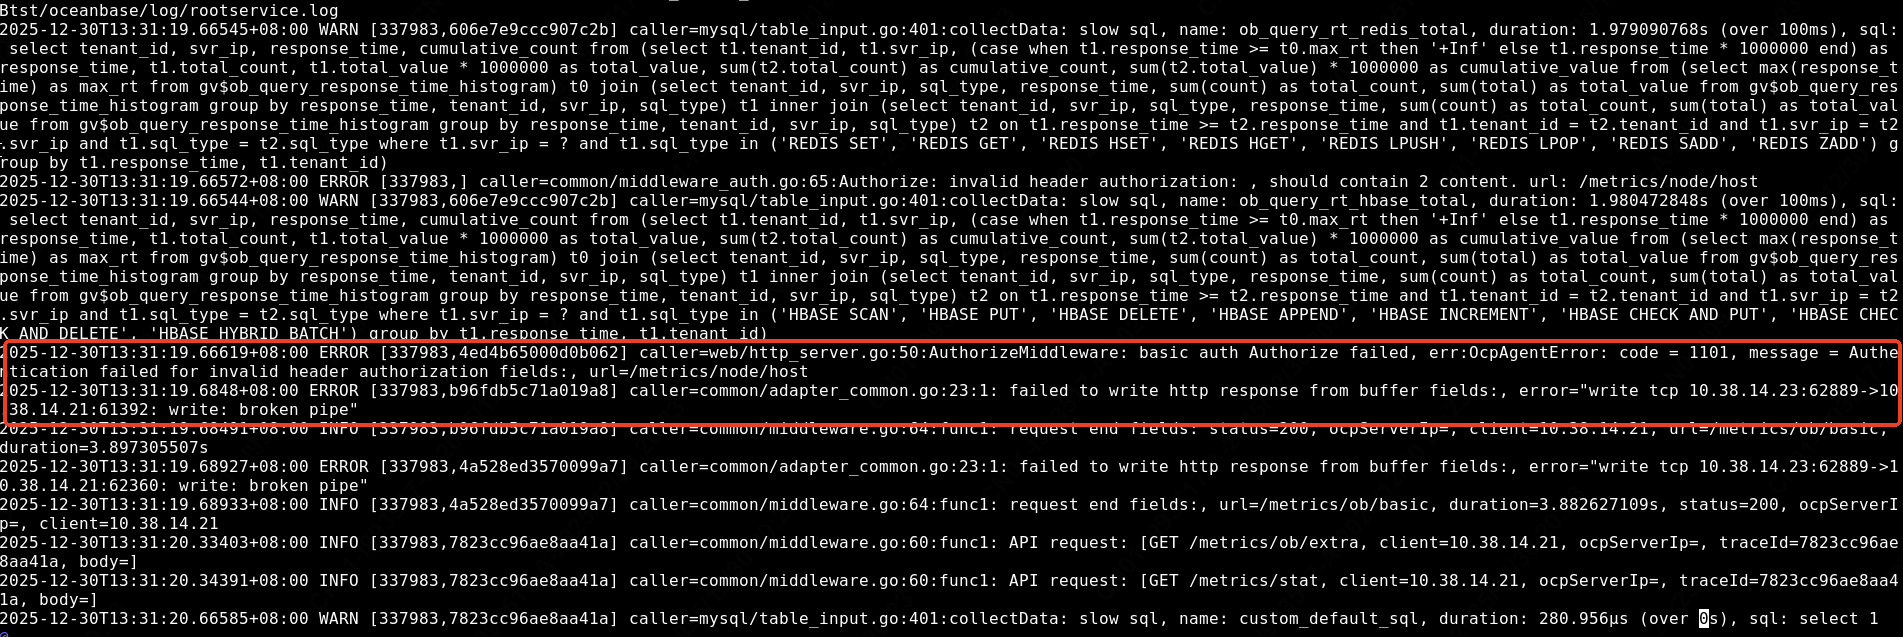
还有这个报错
2 个赞
学习了!
1 个赞
将这个monagent.log完整日志压缩发下,我联系研发看看
1 个赞
链接:https://foreignfile.catl.com/outpublish.html?code=A9936333438b4493fa8fb4af294a2a324&lang=zh-cn#view
密码:B2942040
1 个赞
学习一下
1 个赞
链接:https://foreignfile.catl.com/outpublish.html?code=A9936333438b4493fa8fb4af294a2a324&lang=zh-cn#view
密码:B2942040
日志 发给你了,帮转发给研发,谢谢。
1 个赞
这个集群 之前处理过 ,按照这个帖子 ocp 监控exporter异常,无法拉取监控数据 - 社区问答- OceanBase社区-分布式数据库 里面的方法处理过,其中有一个脚本
#!/usr/bin/python

import base64
import httplib
import json
import sys


def main():
  host = sys.argv[1]
  userPswd = sys.argv[2]
  op = sys.argv[3].lower()
  c = httplib.HTTPConnection(host)
  header = {
    "Authorization": "Basic " + base64.b64encode(userPswd),
    "Content-Type": "application/json"
  }
  if op == "get":
    c.request("GET", "/api/v2/compute/hosts/moduleConfigChanges", None, header)
  else:
    fileName = sys.argv[4]
    content = ""
    if op == "set":
      content = sys.stdin.read()
    print("%s %s" % (op, fileName))
    q = {
      "changes": [{
      "operation": op,
      "scopeType": "global",
      "scope": "",
      "fileName": fileName,
      "content": content,
      }]
    }
    body = json.dumps(q)
    c.request("POST", "/api/v2/compute/hosts/moduleConfigChanges", body, header)
  r = c.getresponse()
  print(r.status)
  print(r.read())

if __name__ == '__main__':
  main()
我看日志报错invalid header auth 错误 是不是这个脚本导致的?
1 个赞
在附件中没有看到write: broken pipe 的报错了,只有Authorize: invalid header authorization的报错,这个我再看下,
目前还是和之前一样 有部分监控没有数据是吧?
2025-12-31T05:34:05.37197+08:00 ERROR [282775,] caller=common/middleware_auth.go:65:Authorize: invalid header authorization: , should contain 2 content. url: /metrics/ob/basic
2025-12-31T05:34:05.37205+08:00 ERROR [282775,39e93705c4d347da] caller=web/http_server.go:50:AuthorizeMiddleware: basic auth Authorize failed, err:OcpAgentError: code = 1101, message = Authentication failed for invalid header authorization fields:, url=/metrics/ob/basic
2025-12-31T05:34:05.40238+08:00 WARN [282775,2e58613c4d1b7636] caller=mysql/table_input.go:407:collectData: slow sql, name: custom_default_sql, duration: 34.495806ms (over 0s), sql: select 1
1 个赞
是的。还是没有监控数据
1 个赞
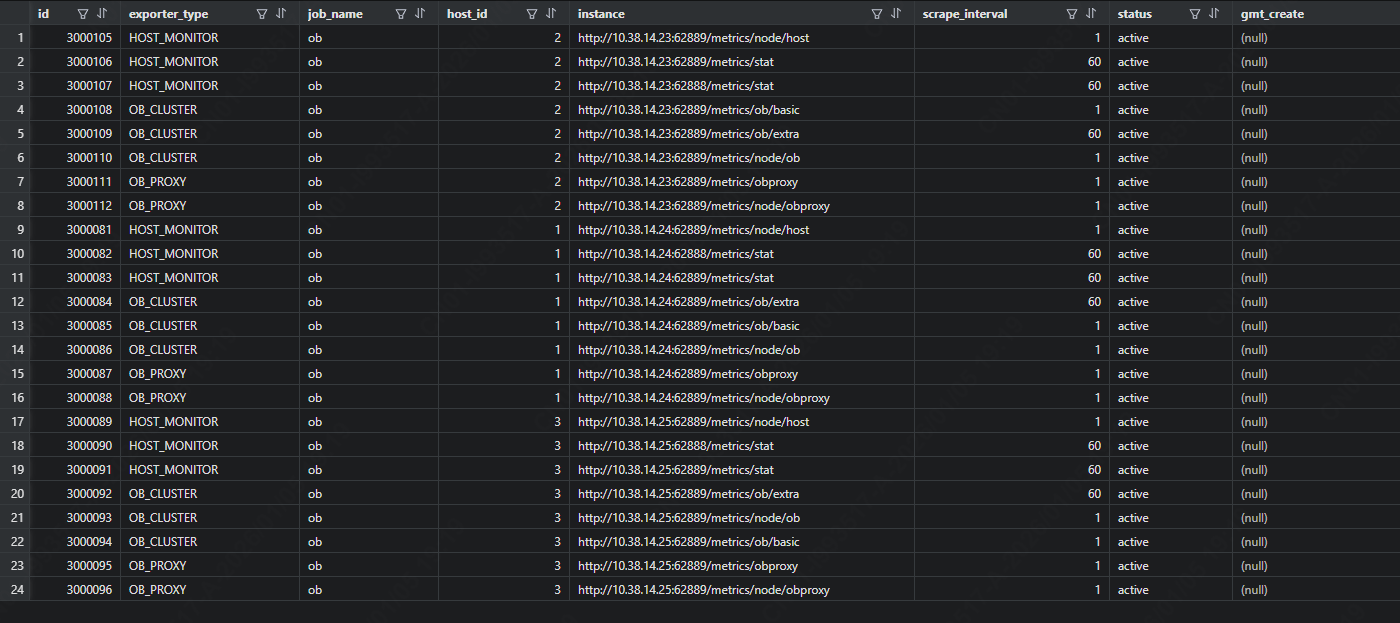
连接到 OCP Meta 租户后查看:
MySQL [(none)]> use ocp;
Database changed
MySQL [ocp]> select * from ocp_exporter_address where instance like '%xx.xxx.211.84%';