【 使用环境 】测试环境
【 OB or 其他组件 】4.1.0.0
【 使用版本 】
【问题描述】清晰明确描述问题
【复现路径】问题出现前后相关操作
【问题现象及影响】
启动配置文件
## Only need to configure when remote login is required
# user:


oceanbase-ce:
  servers:
    - name: server1
      # Please don't use hostname, only IP can be supported
      ip: 127.0.0.1
  global:
    memory_limit: 64G # The maximum running memory for an observer
    system_memory: 30G
    datafile_size: 192G # Size of the data file.
    log_disk_size: 192G # The size of disk space used by the clog files.
    enable_syslog_wf: false # Print system logs whose levels are higher than WARNING to a separate log file. The default value is true.
    enable_syslog_recycle: true # Enable auto system log recycling or not. The default value is false.
    max_syslog_file_count: 4 # The maximum number of reserved log files before enabling auto recycling. The default value is 0.
    skip_proxy_sys_private_check: true
    enable_strict_kernel_release: false
    root_password: RooT123%%
  server1:
    mysql_port: 2881 # External port for OceanBase Database. The default value is 2881. DO NOT change this value after the cluster is started.
    rpc_port: 2882 # Internal port for OceanBase Database. The default value is 2882. DO NOT change this value after the cluster is started.
    home_path: /data/observer
    zone: zone1

obagent:
  depends:
    - oceanbase-ce
  servers:
    - name: server1
      ip: 127.0.0.1

  global:
    home_path: /data/obagent
    ob_monitor_status: active
    host_monitor_status: active

prometheus:
  servers:
    - 127.0.0.1
  depends:
    - obagent
  global:
    home_path: /data/prometheus
    data_dir: /data/prometheus/data

grafana:
  servers:
    - 127.0.0.1
  depends:
    - prometheus
  global:
    home_path: /data/grafana
    login_password: oceanbase
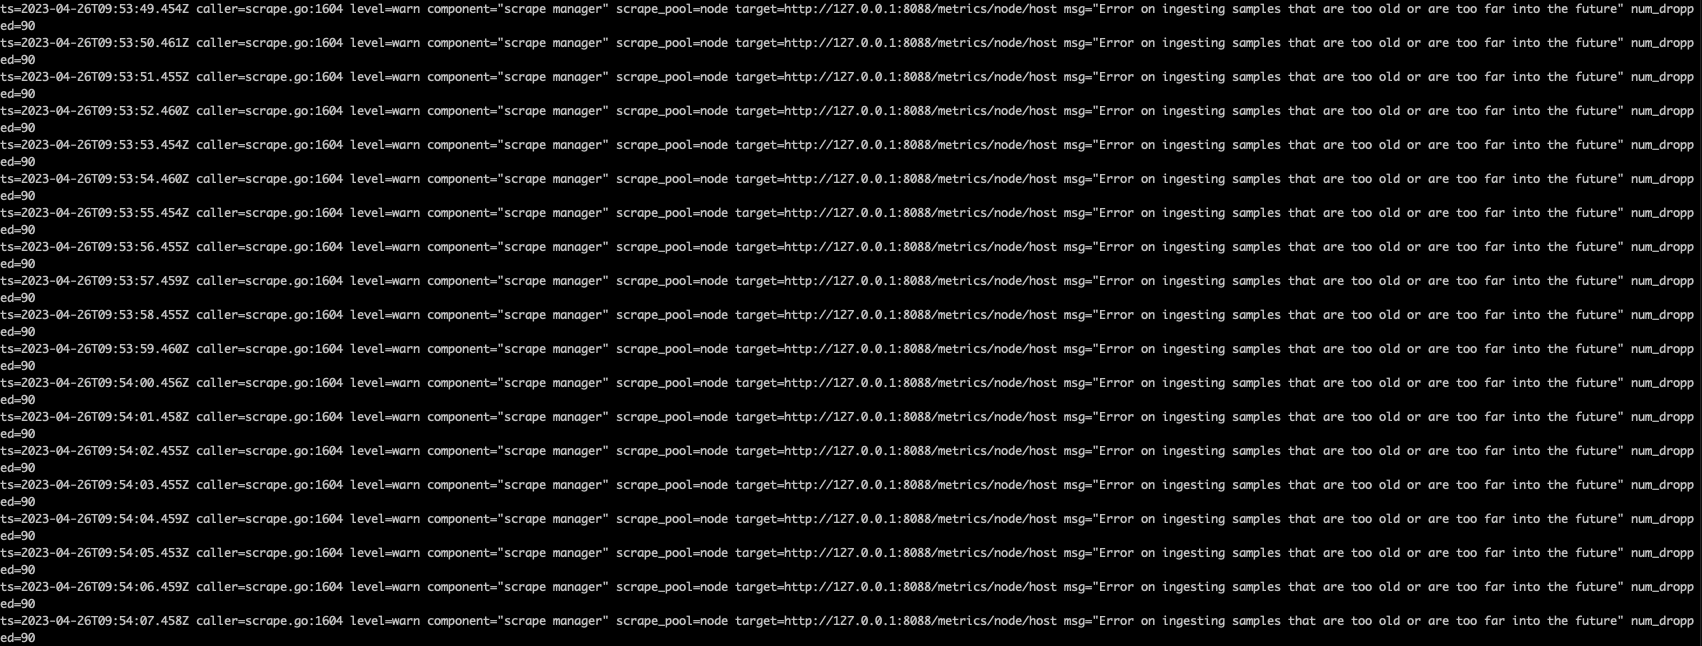
各target状态都是正常的
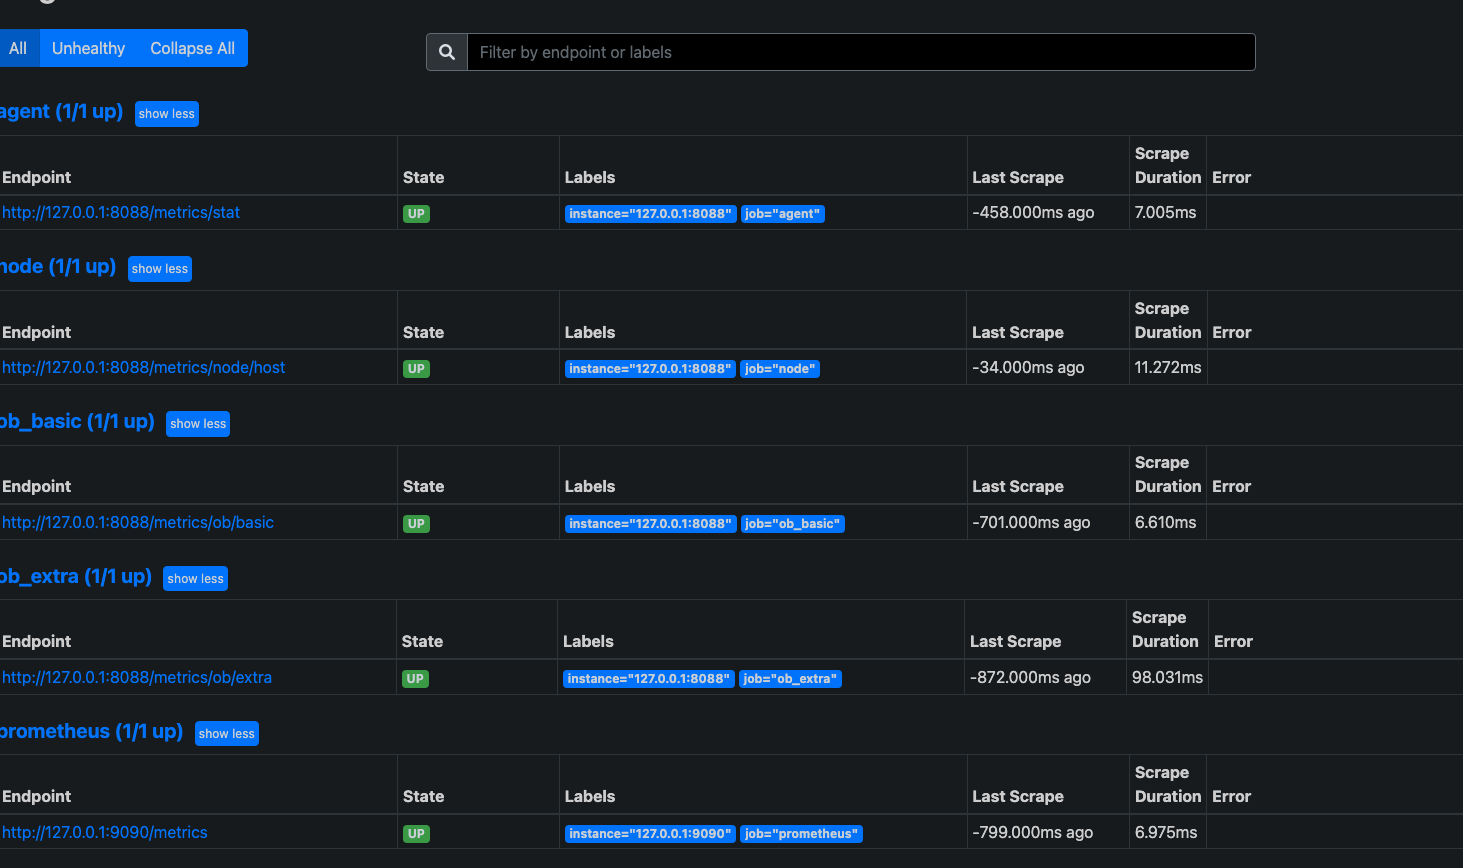
但是没有node 相关的采集项, 导致我现在host 相关的panel没有内容

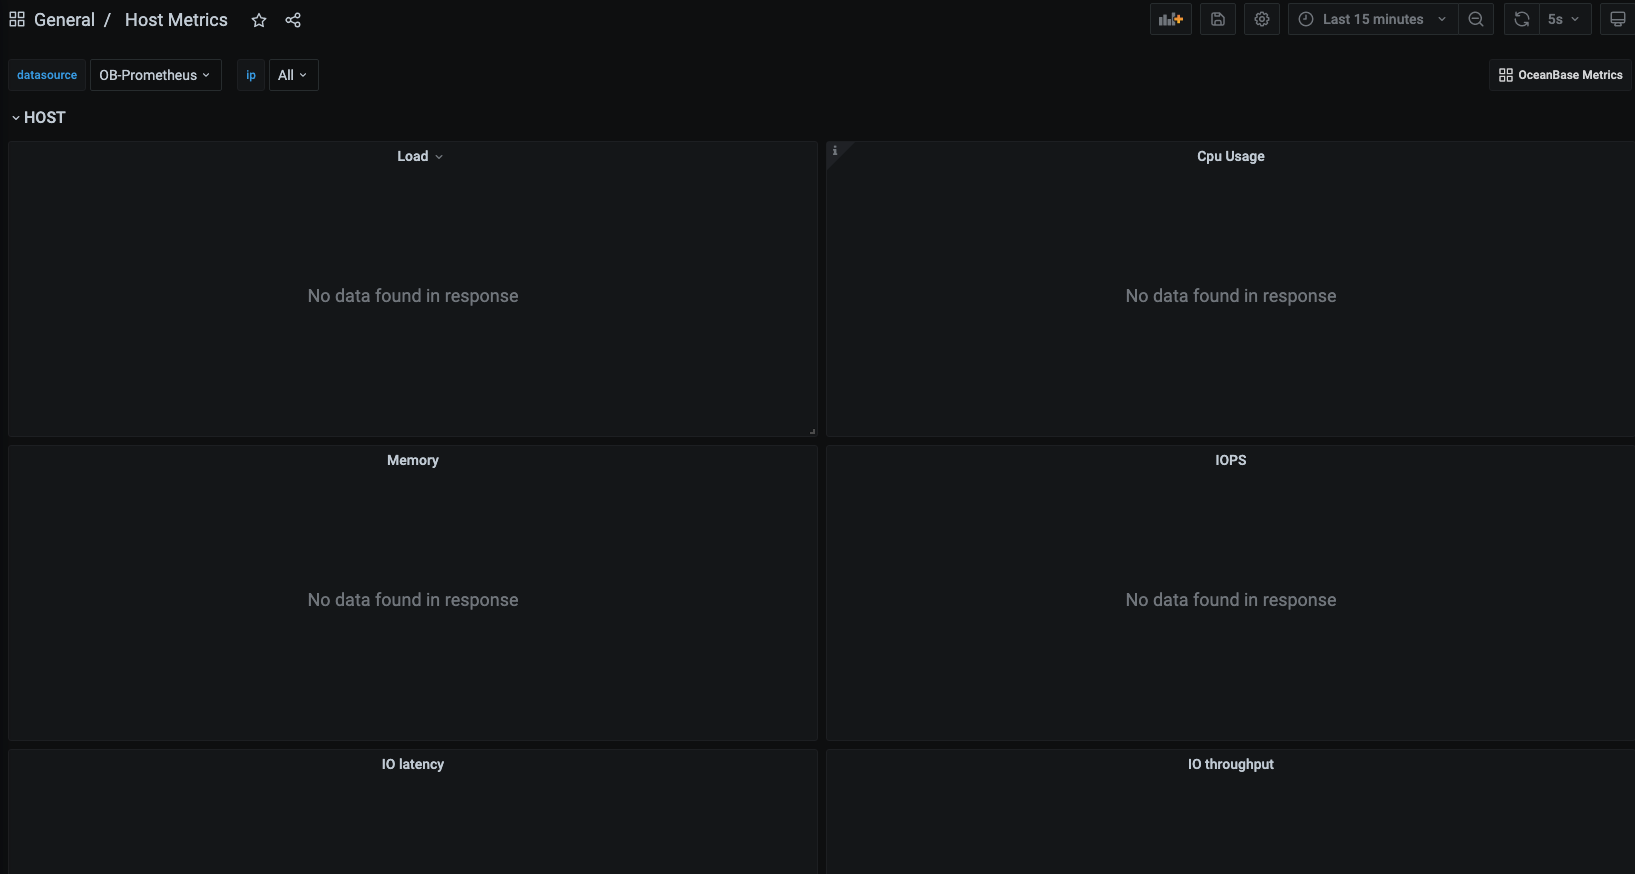
我应该从哪块入手排查
【附件】