【 使用环境 】 测试环境
【 OB or 其他组件 】obagent prometheus grafana
【 使用版本 】4.0.0 oceanbase-all-in-one.4.0.0.0-beta-100120221102135736.el7.x86_64.tar.gz
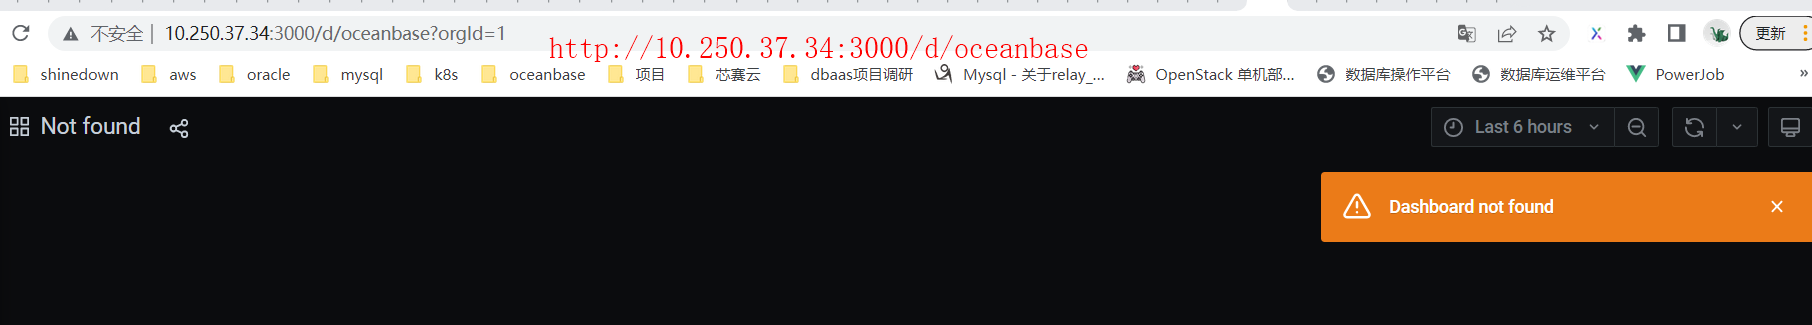
【问题描述】使用all in one部署集群后,不能打开监控agent提供的监控指标
部署方法:
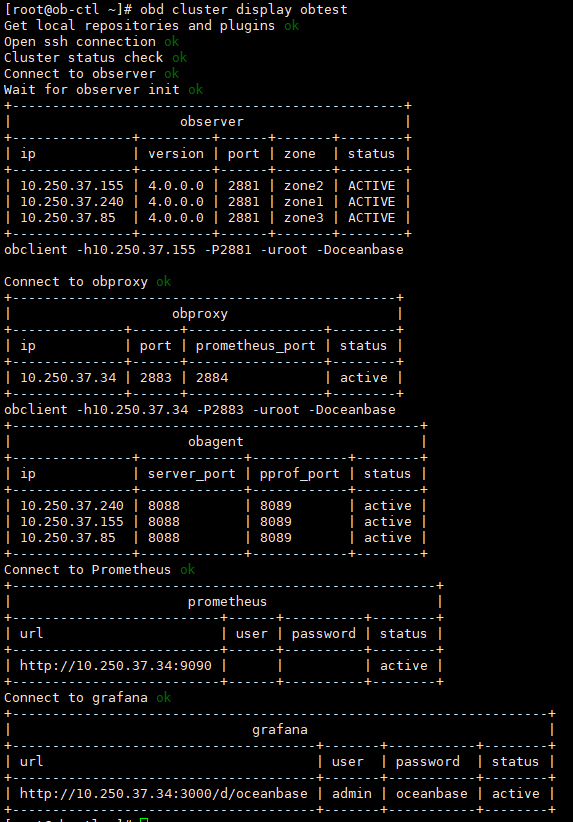
obd cluster autodeploy obtest -c all-components.yaml
显示部署成功

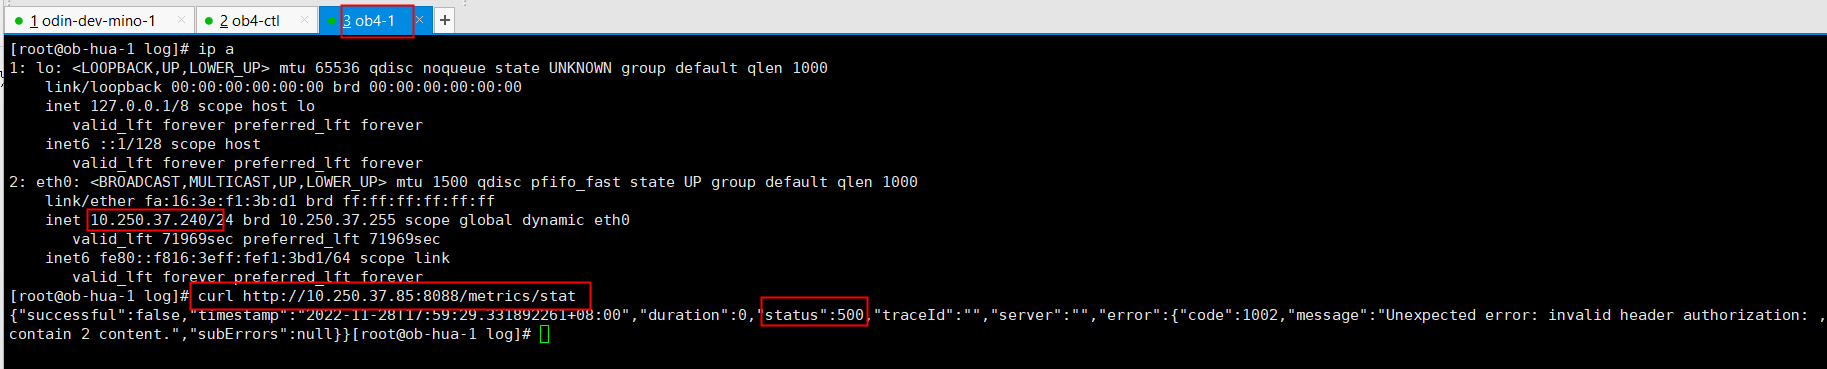
但是访问指标返回错误如下:
http://10.250.37.85:8088/metrics/stat
{“successful”:false,“timestamp”:“2022-11-28T17:52:08.040660745+08:00”,“duration”:0,“status”:500,“traceId”:"",“server”:"",“error”:{“code”:1002,“message”:“Unexpected error: invalid header authorization: , should contain 2 content.”,“subErrors”:null}}
【复现路径】问题出现前后相关操作
【问题现象及影响】
【附件】
all-components.yaml
Only need to configure when remote login is required
user:
username: your username
password: your password if need
key_file: your ssh-key file path if need
port: your ssh port, default 22
timeout: ssh connection timeout (second), default 30
oceanbase-ce:
servers:
- name: server1
# Please don’t use hostname, only IP can be supported
ip: 10.250.37.240
- name: server2
ip: 10.250.37.155
- name: server3
ip: 10.250.37.85
global:
# Please set devname as the network adaptor’s name whose ip is in the setting of severs.
# if set severs as “127.0.0.1”, please set devname as “lo”
# if current ip is 192.168.1.10, and the ip’s network adaptor’s name is “eth0”, please use “eth0”
devname: eth0
# if current hardware’s memory capacity is smaller than 50G, please use the setting of “mini-single-example.yaml” and do a small adjustment.
#memory_limit: 64G # The maximum running memory for an observer
# The reserved system memory. system_memory is reserved for general tenants. The default value is 30G.
#system_memory: 30G
#datafile_size: 192G # Size of the data file.
#log_disk_size: 192G # The size of disk space used by the clog files.
syslog_level: INFO # System log level. The default value is INFO.
enable_syslog_wf: false # Print system logs whose levels are higher than WARNING to a separate log file. The default value is true.
enable_syslog_recycle: true # Enable auto system log recycling or not. The default value is false.
max_syslog_file_count: 4 # The maximum number of reserved log files before enabling auto recycling. The default value is 0.
skip_proxy_sys_private_check: true
enable_strict_kernel_release: false
# root_password: # root user password
In this example , support multiple ob process in single node, so different process use different ports.
If deploy ob cluster in multiple nodes, the port and path setting can be same.
server1:
mysql_port: 2881 # External port for OceanBase Database. The default value is 2881. DO NOT change this value after the cluster is started.
rpc_port: 2882 # Internal port for OceanBase Database. The default value is 2882. DO NOT change this value after the cluster is started.
# The working directory for OceanBase Database. OceanBase Database is started under this directory. This is a required field.
home_path: /root/observer
# The directory for data storage. The default value is $home_path/store.
# data_dir: /data
# The directory for clog, ilog, and slog. The default value is the same as the data_dir value.
# redo_dir: /redo
zone: zone1
server2:
mysql_port: 2881 # External port for OceanBase Database. The default value is 2881. DO NOT change this value after the cluster is started.
rpc_port: 2882 # Internal port for OceanBase Database. The default value is 2882. DO NOT change this value after the cluster is started.
# The working directory for OceanBase Database. OceanBase Database is started under this directory. This is a required field.
home_path: /root/observer
# The directory for data storage. The default value is $home_path/store.
# data_dir: /data
# The directory for clog, ilog, and slog. The default value is the same as the data_dir value.
# redo_dir: /redo
zone: zone2
server3:
mysql_port: 2881 # External port for OceanBase Database. The default value is 2881. DO NOT change this value after the cluster is started.
rpc_port: 2882 # Internal port for OceanBase Database. The default value is 2882. DO NOT change this value after the cluster is started.
# The working directory for OceanBase Database. OceanBase Database is started under this directory. This is a required field.
home_path: /root/observer
# The directory for data storage. The default value is $home_path/store.
# data_dir: /data
# The directory for clog, ilog, and slog. The default value is the same as the data_dir value.
# redo_dir: /redo
zone: zone3
obproxy-ce:
Set dependent components for the component.
When the associated configurations are not done, OBD will automatically get the these configurations from the dependent components.
depends:
- oceanbase-ce
servers:
- 10.250.37.34
global:
listen_port: 2883 # External port. The default value is 2883.
prometheus_listen_port: 2884 # The Prometheus port. The default value is 2884.
home_path: /root/obproxy
# oceanbase root server list
# format: ip:mysql_port;ip:mysql_port. When a depends exists, OBD gets this value from the oceanbase-ce of the depends.
# rs_list: 192.168.1.2:2881;192.168.1.3:2881;192.168.1.4:2881
enable_cluster_checkout: false
# observer cluster name, consistent with oceanbase-ce’s appname. When a depends exists, OBD gets this value from the oceanbase-ce of the depends.
# cluster_name: obcluster
skip_proxy_sys_private_check: true
enable_strict_kernel_release: false
# obproxy_sys_password: # obproxy sys user password, can be empty. When a depends exists, OBD gets this value from the oceanbase-ce of the depends.
# observer_sys_password: # proxyro user pasword, consistent with oceanbase-ce’s proxyro_password, can be empty. When a depends exists, OBD gets this value from the oceanbase-ce of the depends.
obagent:
depends:
- oceanbase-ce
servers:
- name: server1
# Please don’t use hostname, only IP can be supported
ip: 10.250.37.240
- name: server2
ip: 10.250.37.155
- name: server3
ip: 10.250.37.85
global:
home_path: /root/obagent
ob_monitor_status: active
prometheus:
depends:
- obagent
servers:
- 10.250.37.34
global:
home_path: /root/prometheus
grafana:
depends:
- prometheus
servers:
- 10.250.37.34
global:
home_path: /root/grafana
login_password: oceanbase